

Comparing US 2010 and 2023 annual rates, deaths are up 28% and births are down 15% – comparing averages of 2010-19 to 2020-23 averages, the death rate is up 22% and the birth rate is down 10%

Using data from here for deaths and population:
United States Deaths 2023, How Many Deaths in United States 2023 | Dead or Kicking
Note the 2023 population and death numbers are the latest estimates in the top left-hand corner of the “Dead or Kicking” website that has this graphical representation of the extra 560,000 or so deaths EACH YEAR over 2020, 2021 and 2022.

The x-axis of the chart has not been updated for the 2023 deaths in the top left-hand corner of 3.39 million. I had been hoping that, given the disappearance of demand for the C19 mRNA injections, that this number of deaths would drop considerably to around 3 million – fingers crossed it will be revised downwards substantially.
And here for births:
How many people die and how many are born each year? - Our World in Data
2023 numbers are taken from the census.gov site and presumably are also estimates.
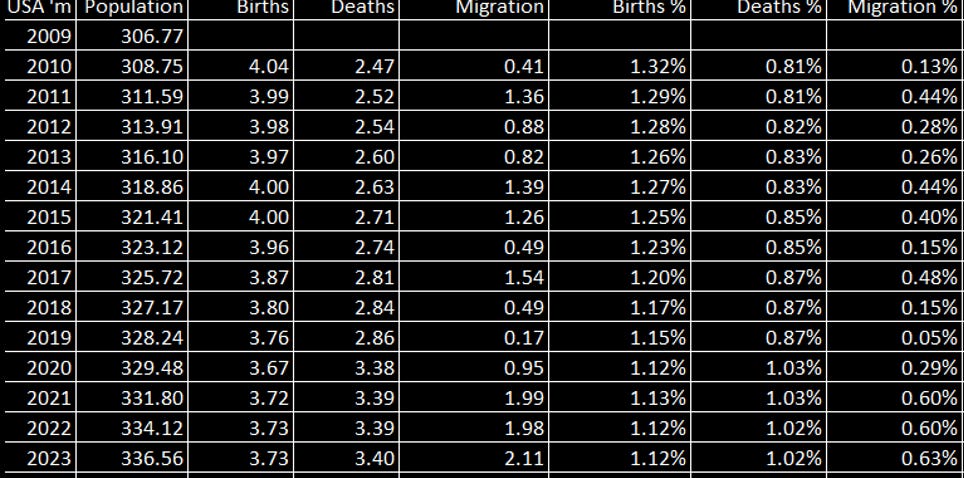
We can derive this table for annual numbers starting in 2009.
The WONDER system will no doubt have a version of this with different numbers!
Pretty busy table!
The migration numbers are derived from the starting population from the closing population subtracting births ad adding deaths. I have no idea how illegal immigration is reflected in deaths or population numbers or how “dropped anchors” are reflected in births, pre and post border crossing.
Suffice to say that the total for 2010 to 2023 comes to around 15 million – around 1 million a year or average and the last three years under Biden total six million – compared to some recent claims of ten million.
Here’s a table that averages the annual rates for two periods between 2010 and the last year before C19 of 2019, and then for the C19 years of 2020 to 2023 inclusive.
The top row in the table is a point-to-point comparison of the annual rate in 2010 and the annual rate in 2023.
The next two rows are annual averages for each of 2010-2019 inclusive – all pre-C19 – and the annual average for the four years from 2020 to 2023 inclusive.
As a rule, raking percentages of percentages is not a great idea, but it will at least give is a place to start before we all launch into “dumbfounding factors” like “aging population” and immigration.
We all know about immigration and are watching death rates. The decline in the rate of births is “the next shoe to drop”.
Taking all that together, the US population is up some 30 million or 10% since 2010.
Onwards!
Please subscribe or donate via Ko-fi – any amount from 3 bucks upwards. Don’t worry and God Bless, if you can’t or don’t want to. Ko-fi donations here: https://ko-fi.com/peterhalligan - an annual subscription of 100 bucks is one third less than a $3 Ko-fi donation a week!
UK Column talked about excess deaths in their news report yesterday 3 Jan. https://www.ukcolumn.org/video/uk-column-news-3rd-january-2024 - (towards beginning) Seems OECD is adjusting members' excess death figures to make them seem less scary.