

Data doodling – big picture 2022 comparison of the US against China, India, Germany and Japan - with a few CO2 emissions comparisons

Using data for end-2022, here is a table of populations, GDP and government debt.
Numbers for nominal GDP and Government debt are in trillions of US dollars
GDP - Countries - List (tradingeconomics.com)
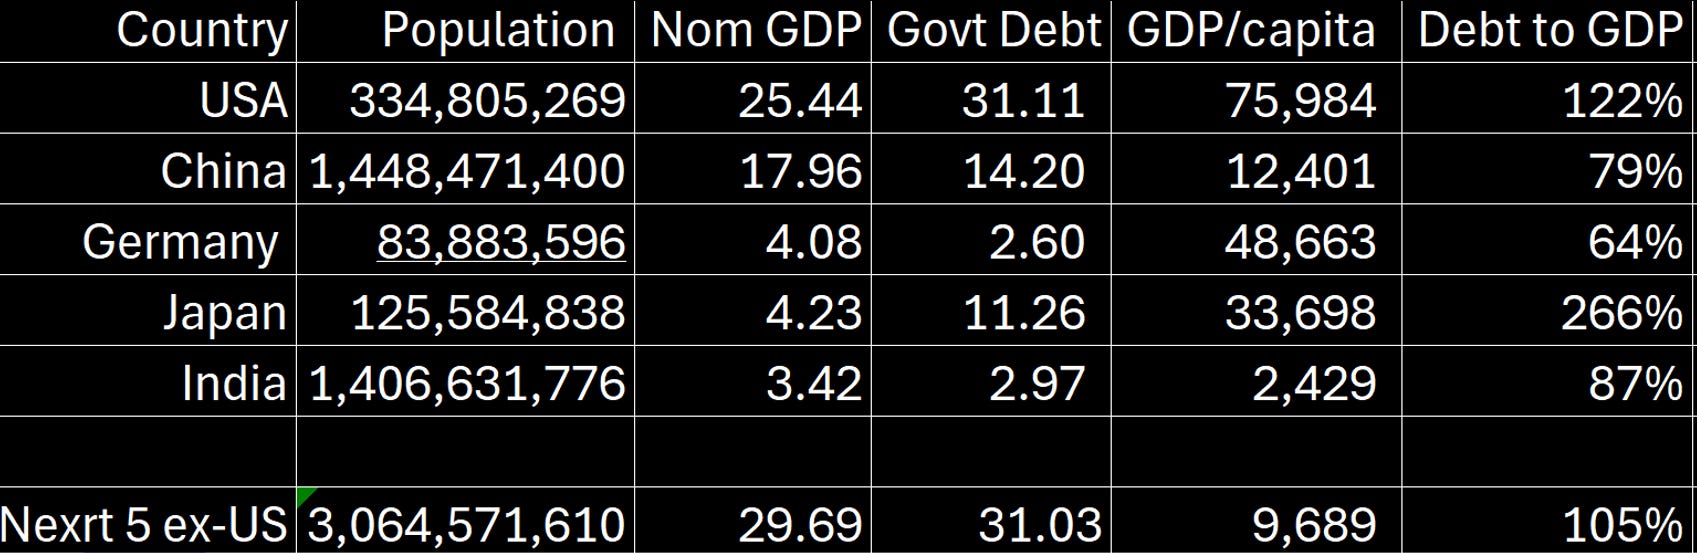
The debt and GDP numbers data is for December 2022 and does not reflect the current US government debt - which will pass 35 trillion bucks before the November 2024 elections - or recent increases in GDP. Still, it provides some sense of how things were, 18 months ago. The population numbers are the latest from WorldOMeter.
Imagine how Japan would cope if its economy ever got back to a more “normal” 4% interest rate, made up of 2% inflation and 2% GDP growth. Its rates are still set at zero, so a 4% increase would result in an additional 10% jump in debt to GDP (250% times 4) every year the 4% rate persisted!
According to the vagaries of the calculation of GDP, US people are SIX TIMES more productive than people in China and 50% more productive than people in Germany. So, there is that.
Compare US and China GDP per capita to their CO2 emissions - from here:
CO₂ Emissions by Country 2024 (worldpopulationreview.com)

China produces less and pollutes more!
As for India, well, least said the better, but maybe they smile a lot more.
A propos of nothing in particular, I wonder if the depopulationists, who think mankind is an infestation of the planet, think that wiping out India and China is the best place to begin their plans for “eugenicide” bfore they react to the “you first” f th rest of us?
Onwards!!!
Please take a paid subscription or forward this article to those you think might be interested. You can also donate via Ko-fi – any amount from three dollars upwards. Ko-fi donations here: https://ko-fi.com/peterhalligan
Oh no. All is now focused on western democracies..covid proved we are the ones standing in the way of depopulation and digital tyranny. Tney can. Wait