
If the infection fatality rate for C19 is the same as the flu, did medical malpractice and politics cause ALL excess deaths since the start of the pandemic? A few random, background thoughts

Over the last few days, I have been thinking about the significant implications of the sub-0.2% INFECTION fatality rate calculated in the recent Ioannidis pre-print study. My thoughts are, as yet, not entirely lucid. I aspired to “back into” an analysis of US C19 deaths, especially amongst the elderly, as opposed to how many died from non-C19 impacts. That is, deaths from C19, deaths from non-pharmaceutical interventions (NPI’s) In 2020 like lock-downs, plus those that died from murderous interventions like the use of Remdesivir and respirators.
Suffice to say “it’s complicated”. Those who prefer precision and clear conclusions should skip this article!
Broadly speaking, the Ioannidis study of INFECTION fatality rates amongst <70’s gives an opportunity to reflect on the completely unwarranted NPI’s for a non-existent emergency, but also a chance to think about the potential scale of iatrogenic geronticide in places like New York City and elsewhere.
iatrogenic - relating to illness caused by medical examination or treatment:
Geronticide: killing the elderly
Democide - the murder of any person or people by their government
Maybe we need a new word – Demogeriatrocide or DGI for short!
The equivalent of the US use of Remdesivir and respirators in the UK, was the use of Midazolam (banned from using as part of lethal injections in executions in US States) plus morphine – both of which reduce respiration – which would be contra-indicated for a respiratory condition! The UK’s Medical Health Regulatory Authority advised against the use of Midazolam in March 2020, the UK’s National Institute of Clinical Excellence (!) prescribed its use (even though it is off label with no evidence of clinical benefit) in April 2020 and the British Medical Journal recommended it, also in April 2020, meaning all UK doctors were told to use the Midazolam/morphine protocol.
Those seeking a refresher on the massive incentives for sacking unvaxxed US medical staff in exchange for bounties for injecting Remdesivir can scoot to here.
A deeper dive on Remdesivir (aka "Run Death is Near" (substack.com)
Perhaps the hospitals that engaged in this mercenary behaviour are expecting huge leaps in revenue from treating “vaccine” adverse events to make up for the massive tax payer subsidies they enjoyed over the last three years as C19 itself diminishes to endemicity.
Before we plough into my somewhat rambling thoughts relating to that Ioannidis pre-print study, here is an observation or two.
I can find no studies that compare the ratio of EXPOSURES to the SARS-COV2 virus with INFECTIONS or CASES resulting from that EXPOSURE to the virus. Maybe everyone that is exposed to the virus gets infected, maybe only half of those exposed get infected. Maybe those exposed have important characteristics for the prevention of infection, maybe they don’t.
RECOVERY rates in clinical trials are not referenced in analyses to assess the need for any treatment. Why treat anyone if the RECOVERY rate is 96-97% of 3% annualized CASE rate (globally, there have been 620 million recoveries from 640 million “cases” over the almost three years of the pandemic). Nine million people a year die from starvation (plenty of food, just not affordable for many) and 2.7 million people a year die from pneumonia – easily treatable, but no co-ordinated effort by the WHO. Neither pneumonia or starvation is a Public Health Emergency of International Concern (PHEIC – pronounced FAKE), action to address both is simple, easy and cheap.
No ”Environmental Assessment” has been done for the trillions of masks and wet-wipes made and disposed of, or the tens of billions of gloves, PPE, tests and injections (manufacture, packaging and disposal of used tests/needles/packaging). So much for diligent “chicken littles” who claim “climate change” is a clear and present danger to the planet so that livestock must be replaced with bugs and all hydrocarbon fuel use must be stopped.
A mini-rant on the “Climate Agenda” - Oil is NOT a fossil, neither is gas, so calling them fossil fuels is a display of stupidity – CO2 is plant food. so cutting down on CO2 emissions is cutting down on plant food – switching to “plant foods” can be achieved by eating vegetable! If you want a quick 13 minute run-down of the climate fraud being perpetrated that has caused energy costs to leap 5-10 times in the last few years, via massive taxpayer funded subsidies to “green” energy and massive taxation on hydrocarbon energy producers, check this 13 minute video out:
My Gift To Climate Alarmists - YouTube
Also note that the mortality data is based on the assumption that RT-PCR tests in 2020 actually correctly diagnosed cause of death from C19, rather than deaths with C19 present (amongst 2-6 co-morbidities) and that lock-downs and treatment protocols (like the use of Remdesivir, withdrawal of nutrition and hydration, respirators plus isolation) were not the most significant cause of death in hospitals, care homes and homes.
Ok, let’s dive in.
Globally (or at least in the dozens of countries in the study) here’s the INFECTION fatality rate data for the under 70’s from the Ioannidis study
Ages 60-69, fatality rate 0.501%, survival rate 99.499%
Ages 50-59, fatality rate 0.129%, survival rate 99.871%
Ages 40-49, fatality rate 0.035% survival rate 99.965%
Ages 30-39, fatality rate 0.011%, survival rate 99.989%
Ages 20-29, fatality rate 0.003%, survival rate 99.997%
Ages 0-19, fatality rate 0.0003%, survival rate 99.9997%
(I copied this table from the Brownstone Institute paper here ), I am not sure why “survival” rate is used instead of “recovery” rate!)
This is for all the countries in the Ioannidis study; let’s focus on the US.
At the bottom of page 25 of 50 of the Ioannidis study for under 70’s we have this chart:

The INFECTION fatality rate for under 70-year-olds in the US looks to be 0.18%. People in Ireland, Germany and Italy might have a few questions, though they need to be put in the context of INFECTION and CASE rates in 2020.
Worldometer data has it that at the end of 2020, there were 20,777,000 “CASES” in the US and 376,000 deaths with C19 present – that is the US POPULATION CASE rate for 2020 was 6.3%, a POPULATION fatality rate was 0.11% and the CASE fatality rate was 1.81%, compared to the INFECTION fatality rate of 0.18% amongst under 70-year-olds in the Ioannidis pre-print study. (Out of interest, at end June 2020, there were 2,794,000 CASES and 131,000 deaths with C19 present).
Before adjusting for the difference in population size between the whole US population and those under 70, the inference of the 0.18% (eyeballed from the above chart) INFECTION fatality rate and the (whole population) 376,000 deaths in 2020 with C19 present, is that there were around 208.9 million INFECTIONS in the US in 2020, compared to the 20.8 million CASES detected amongst the whole population. However, we need some “apples with apples” adjustments to remove the deaths of the over 70’s from all age cohorts, then compare CASE fatality rates for <70’s with the INFECTION fatality rates of <70’s.
This proves difficult because easily extractable mortality data for C19 ib the same age cohorts “buckets” is hard to find.
I have attempted a “spline” from the data I could grab.
C19 deaths by age cohort through 17 February 2021

This has 48 days extra 2021 data that must be removed and an adjustment made to get to the under 70’s classification used in the Ioannidis study. (I appreciate that some readers may have this data in its pure form, but this is what I have to work with!).
The deaths in the above chart sums to 460,234 deaths with C19 present to 17 February 2021 for all ages. The number of deaths with C19 present in 2020 for all ages = 376,000.
To get to the number of deaths in 2020 per age cohort, I first scale down the 17 February 2021, assuming the same mortality rate per age cohort to get to full year 2020 numbers. Then I take half the 65-74 cohort to reconstitute a 65-69 cohort, sum this derived cohort and the younger cohorts to arrive at <70 year mortality number for 2020 of 111,366. I do the same to extract the <70-year US population of 290.1 million (39.4m out of a total 2020 US population of 329.5 million are >70). I ignore migration within 2020 age cohorts, not all that precise I know, but precise enough.
So, we have a POPULATION fatality for US <70’s of 111,366 amongst a population of 329.5 million = 0.03% for 2020.
This leaves (376,000 – 111,366 =) 264, 364 deaths amongst 39.4 million >70’s for a POPULATION fatality rate of 0.67% for 2020 – twenty two times higher than the <70’s.
The Ioannidis study calculates the INFECTION fatality rate of 0.18% for that 329.5 million <70 years old.
INFECTIONS = 111,366 C19 deaths/ 0.18% INFECTION fatality rate = 61.9 million INFECTIONS and an under 70’s population INFECTION rate of 19% for 329.5 million <70’s.
We need to work out the CASE rate for under 70’s to finish the exercise to compare the INFECTION rate with the CASE rate. I cannot find cumulative 2002 data by age cohort, but we do have this:
COVID-19 Stats: COVID-19 Incidence,* by Age Group† — United States, March 1–November 14, 2020§ Weekly / January 1, 2021 / 69(5152);1664

Eye-balling that chart reveals that CASES per 100,000 were markedly higher amongst 18-44 year olds by the end of 2020 whilst 14-17 year olds, 45-79 year olds and over 80’s were the same by the end of the year.2
Case rates per 100,000 for the Over 80’s peaked in April and May of 2020 (care home “cull”?) but otherwise tracked case rates per 100,000 for other age cohorts thereafter.
On a cumulative basis, it looks to me that there are only marginal differences in CASE rates per 100,000 amongst the different age cohorts – implying that perhaps INFECTION rates and CASE rates have a linear relationship amongst cohorts.
The POPULATION fatality rate for the >70’s = 264,434 / 39.4 million = 0.67%. I maintain that the CASE rate for the over 70’s is broadly similar to the overall population CASE rate of 6.3%. This implies there were around 2.5 million CASES amongst >70’s.
The INFECTION fatality rate for over 70’s is around 5.5%, so INFECTIONS were around 4.8 million and the INFECTION rate was around 12%, compared to the INFECTION rate of 19% for those <70 years old.
I have taken the 5.5% rate from the table below (that I cannot for the moment source!):
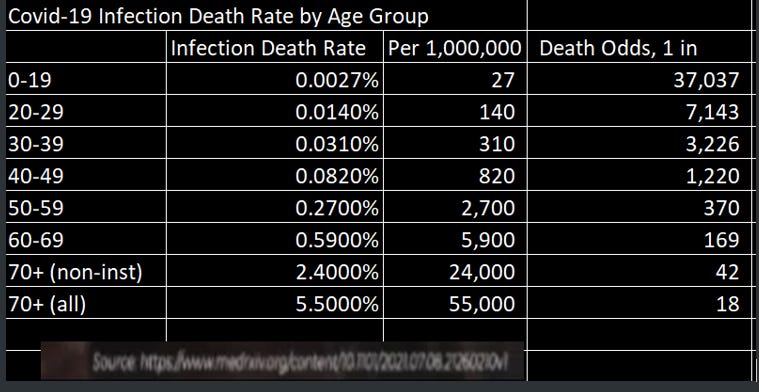
All thoughts/suggestions/comments welcome!
Data sources (hyperlink first then https address)
US Mortality Update 35/2022 (substack.com)

(There is an update to week 36, plus the website United States Weekly All-Cause Deaths - US Mortality Monitoring – www.usmortality.com).
United States COVID - Coronavirus Statistics - Worldometer (worldometers.info)
https://www.worldometers.info/coronavirus/country/us/
https://www.medrxiv.org/content/10.1101/2022.10.11.22280963v1.full.pdf
Data Visualization | COVID-19 Deaths by Age | The Heritage Foundation
https://datavisualizations.heritage.org/public-health/covid-19-deaths-by-age/
Estimated COVID-19 Burden | CDC
Criminal Prosecutions begin for Remdesivir treatments causing death (substack.com)
Their dark theory of contagion is at heart of their scam. Remember how they prevented elderly people from seeing their relatives during the heart of their fake pandemic? It was always "Covid" that "tipped the balance" whenever any of these elderly people succumbed to illness. You could have heart disease or cancer for years, but those factors didn't matter--it was Covid that they put down on the death certificate.
And how exactly could they prove that an elderly person could die if you personally were in the room with them? Actually, there was never any evidence because this illusory idea of "transmission" is not measurable. It's as if you're being a convicted of a crime based on a general theory of how a crime is committed without there being any evidence that you personally were responsible. But nonetheless we're told in the most specious general terms that we ALL "could" infect such "vulnerable" people. What a crock of shit!
Their theory that the mere presence of a novel Coronavirus equals CAUSATION of cell death (cytopathic effect) is just that: a theory! But the medical dictators insist that their narrative is sacrosanct, and no one is permitted to challenge it. If you do you are being accused of spreading "medical misinformation."
Even people such as Steve Kirsch and Dr. Mercola who have done great work in pushing back against this terrible medical tyranny, are enamored with this germ theory that has never been properly vetted in a real-world clinical study involving thousands of subjects. Instead, we must rely on tests of an extremely small sample of subjects utilizing contaminated tissue cultures and computer simulations of fragments of genetic material.
The bottom line is that the main factor in the death of those elderly people locked away from seeing their relatives was loneliness--a crime against humanity.
The fact that we are not permitted to question the theory of a "killer" virus (ascribing anthropomorphic qualities to sub-microscopic particles which on the surface appears ridiculous) should be a clue that their theory is bogus.
We are in trouble when bright people on our side will not even concede that the theory of contagion has never been properly vetted. We must question EVERYTHING these medical tyrants do and say even if it means demolishing generally accepted shibboleths.
Thank you for yet another incisive, enlightening post.