Initial thoughts on the 125-country study that proves all interventions (pharma and non-pharma) imposed by the WHO, country health regulators and all levels of governments –
enabled by propaganda from the MSM - were useless, deadly and harmful.
First off, the paper is a complete rebuttal of the WHO power grab that supports the global standardisation of pandemic measures. The measures were not needed and caused deadly and harmful outcomes for zero benefit. Only the well-known maxim of “coughs and sneezes spread diseases” mitigated by social distancing has a remote shred of validity. Masking did not work; lockdowns did not work, and the experimental injections were deadly.
All this was known IN ADVANCE, indicating pre-meditated murder and battery assault of all those injected ad subjected to regulatory actions.
Big pharma’s marketing strategy of injecting 100% of the population to precent less than 0.1% fatalities whilst causing more than 0.1% annual harms has bene exposed for what it is – a crime syndicate.
There are a few key issues that need to be raised. One is, did the experimental injections using failed mRNA and viral vector platforms reduce all-cause mortality (we already know were not intended to reduce transmission and infection). Secondly, what about “natural immunity”?
On the first point (the claim that injections saved lives), from page 255 of the 521-page report we have this:
1. “… large peaks of excess all-cause mortality most often continue to occur during and after COVID-19 vaccine rollouts…”
2. “… The largest values of excess all-cause mortality most often occur in late 2021…!
3. “… n this connection, there is often a large December-2021-January-2022 peak in excess all-cause mortality (22-0 peak, Section 4.5), which is essentially synchronous with a COVID-19 vaccine (booster) rollout.”
4. “… many countries have no measurable excess all-cause mortality, until the vaccines are first rolled out.”
5. “…many countries have no measurable excess all-cause mortality, until the vaccines are first rolled out.”
6. “…There is often a large December-2022-January-2023 peak in excess all-cause mortality (23-0 peak, Section 4.4), apparently coincident with an advanced booster-dose rollout, in countries with extensive COVID-19 vaccination programs, approximately four months prior to the 5 May 2023 WHO declaration of the end of the declared pandemic.”
7. “…here is often a significant persistent excess all-cause mortality into 2023 (2023-H1*:
8. “There are no reliable correlations between excess all-cause mortalities and COVID-19 vaccine administration, which are not confounded by correlations between vaccine administration and socio-economic variables.”
9. “in most countries studied, the period with significant excess all-cause mortality is lengthy (3 years or more)”… “which is far too long in duration to be compatible with any postulated viral respiratory disease spreading by contact and producing an epidemic or pandemic, having parameters comparable to those inferred for COVID-19…”
The authors draw this conclusion It would be unreasonable for anyone to conclude that COVID-19 vaccine rollouts decreased all-cause mortality or saved any lives sufficiently to be detectable in national data and its temporal evolution. On the contrary, as indicated in the above numbered points and as discussed below, the COVID-19 vaccine rollout campaigns are significantly associated with excess all-cause mortality. “…
The injections killed people and did not “save” lives.
Ok, on to “natural immunity”. I have pointed out in prior articles that no account is taken of recovery rates – which easily exceed the “efficacy” of the injections. There is no record of recovery rates in any clinical trials. Which rather begs the question - “why “treat” anyone with an experimental infection if the recovery rate is higher than any possible efficacy rat, even using relative, rather than absolute measures?”.
Many have postulated that the infection rate is way higher than the case rate. 2everybody has bee exposed by now”.
The initial RT-PCR test was designed by Corbin ad Drosten using old flu to calibrate the new flu. This is completely bogus. (See here Pharma Downloaded Spike Protein Recipe From Chinese Government?! The Virus Has Never Been Isolated! (bitchute.com))
Did the RT-PCR test for what was claimed to be the deadly attachment – the spike protein?
In a sane world, given the KNOWN adulterations and contaminants in the injections, the manufacturers and regulators would also have tested for these BEFORE people got injected.
Nope. What could possibly possess ay sae individual to mandate every huma being to be injected with instructions to create the deadly spike protein, when 99% of people recovered from the infection of the “naturally occurring” virus and only 2-3% a year of the population was infected? This is the business model of big pharma seeking to sell as many “vaccines” as possible, but it is not logical, scientific or moral.
Which lads to another issue. A body can defeat the “virus” with its immune system. What does the defeated virus with spike protein attached look like? The RT-PCR test cannot distinguish between “live” and “dead” particles. Those who have natural immunity will have “dead” whole or fragmented viral and spike protein particles?
Of toe, a recent HighWire episode with the leading (sacked) Hawaiian epidemiologist claimed that those operating RT-PCR tests shipped in from South Korea, mistook the background positive (out of three readings) to be a positive C19 case!
This “dumbfounding” of the calculation of “cases” is not addressed in this 521-page analysis. Instead, it focusses on the numbers of deaths - and uses UN, WHO, OECD and OurWorldinData for much of its data. OurWorldinData is no stranger to using algorithms and fudge factors to populate its databases. Draw your own conclusions on the supranational and the reliability of their data. (How many countries revised their metrics for deaths attributable by year and cause?).
The 521-page analysis of deaths across continents and countries will, hopefully be subject to much debate and (constructive0 criticism. The work should have been completed by the WHO and wasn’t because it does not have the competence, quality or willingness to support such analysis. The results highlight the WHO’s ineptitude and complicity in a lethal scam. The WHO now seeks to enforce its incompetence in health regulations globally.
The full report is here:
2024-07-19-Correlation-ACM-World-125-countries-Rancourt-Hickey-Linard.pdf (correlation-canada.org)
A few observations on viewing the table of contents and methodology.
A number of charts can be used to apply the Bradford-Hill criteria for each country – I the negative, that is no discernible cause and effect.
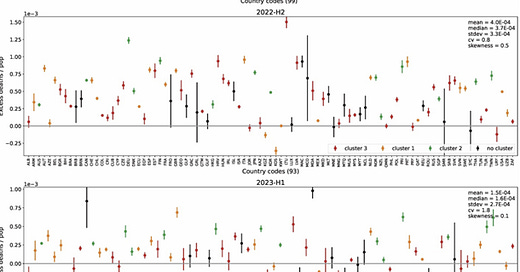
Check out this chart on page 500 of 521 depicting excess mortality in 125 countries for the first 6 months of 2022, when most people had been double dosed in most countries.
Perhaps this will serve to illustrate the lack of any positive impact of any pharma or non-pharma intervention – cluster methodology on page 17.
Countries along the x-axis, excess mortality on the y-axis. Can you see any pattern at all, even when broken down into the three clusters?
Here’s a chart of cumulative excess mortality for the US from page 494 of 521, using the methodology described on page 18 here:
“In the figure of Appendix A, each of the 125 countries has a panel. Each panel has two parts:
(1) Top part: Reported all-cause mortality (blue), by week or by month, and predicted (from the historic or recent pre-Covid period, see Methods) all-cause mortality (orange), 2015-2023, with shaded 1σ-error ranges. “
(2) Bottom part: Calculated excess all-cause mortality (green), by week or by month, 2015-2023, with shaded 1σ-error range.
A slight criticism is that the charts are not dynamically interactive (like the OWD charts for example) – you cannot scroll the mouse over the lines on the chart to extract numbers and dates. Also, on a personal level, white chart backgrounds cause “screen blindness”!
The report is the only report available anywhere in the world that has such depth ad which ca be challenged to improve its basic truths.
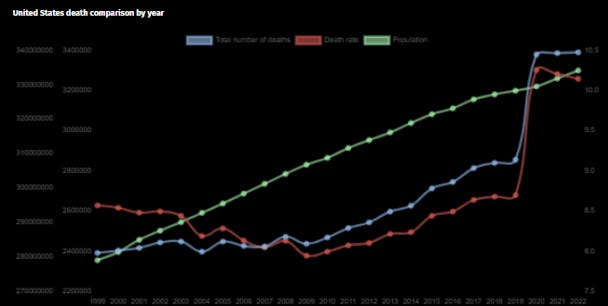
It can be put in the context of charts like this for the US,
United States Deaths , How Many Deaths in United States | Dead or Kicking
The contribution to the extra 2.25 million US deaths over the last 4 calendar years from the injections of evil of around 700,000 since their roll-out – plus several hundred thousand deaths from Remdesivir, ventilators, denial of antibiotics/antivirals, physical and mental torture of those falsely “diagnosed” as a “case”, especially the elderly, poor and weak.
Onwards!!!
Please take a paid subscription or forward this article to those you think might be interested. You can also donate via Ko-fi – any amount from three dollars upwards. Ko-fi donations here: https://ko-fi.com/peterhalligan


