

Land of the setting sun – drowning in fiat currency as the population dwindles – is Fukushima a predictive model for the damage caused by the experimental C19 mRNA injection harms in decades to come?

A cursory glance at population trends in Japan reveals a country that is “depopulating”.

Fukushima occurred on 11 March 2011. Now, corelation is not causation – no doubt the WHO knows all about this and is advising the Japanese government on mitigation measures for the 28% decline in birth rates since 2010 and the 31% increase in the death rate. Perhaps it can work out the human trafficking of around 4.4 million people to make up for the fall in population!
These numbers do not include 2023 – but the rate of decline in birth rates from 2020 to 2021 and then to 2022 are accelerating – and the rate of increase in deaths is increasing.
Japan has reported less than 75,000 deaths with C19 present over the fur years of the scamdemic, but has administered 383 million experimental C19 mRNA doses – probably killing 383,000 Japanese people (seriously injuring at least another 1.5 million and severely injuring another 5 million).
The Nikkei-225 index for the Japanese stock market has bee o a tear recently = at the same time as the Japanese yen has been plumbing low levels.
Here’s a snapshot of the trade weighted yen over the last decade or so from here:
Japanese Yen Currency Index — TradingView

Down from a peak of around 132 at the start of 2012 to below 65 currently – for a fall of around 50% on a trade-weighted basis – using the JXY (the equivalent of the DXY for the US dollar trade weighted index).
Here’s a chart of the Nikkei-225 index for the same 12 years from here:
Nikkei 225 (^N225) charts, data & news – Yahoo Finance
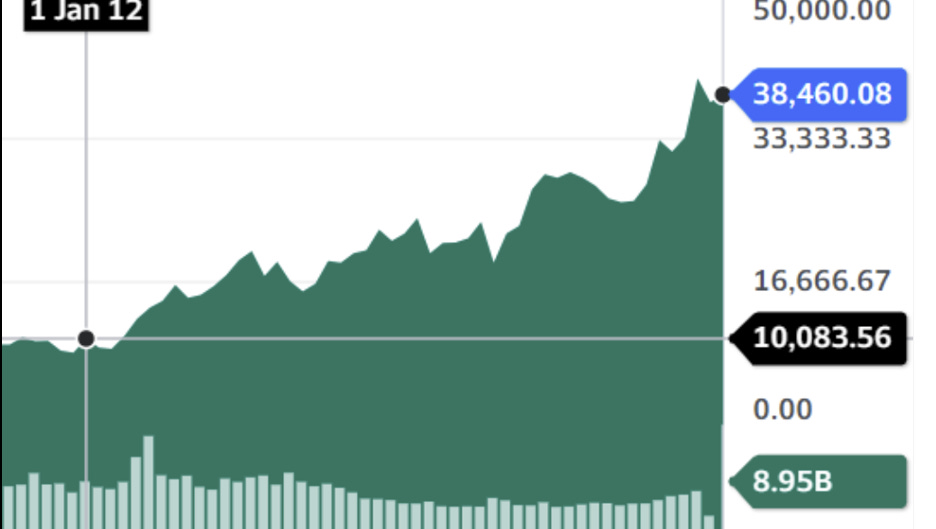
So, the Nikkei-225 index has quadrupled in price, but the yen trade-weighted currency (JXY) has halved.
The US dollar is a significant component of the JXY ad the US has the largest pools of capital chasing investment returns globally, so let’s check out the yen/dollar fx rate over the last 12 years and calculate what the return would have been for a US based investor.
The yen/dollar fx rate at the start of 2012 was around 75 – one US dollar bought 75 yen. Now one US dollar buys 155 yen.
FX markets do this sort of thing over long periods of time, such changes are not unusual – I have seen the Euro fall from its issue rate of buying 1.199 US dollars on I January 199 – fall to buying just 80 cents, peak at veer 1.60 dollars per euro an chuckle at reporters when it wobbles at around 1.06 to 1.08 US dollars per euro.
Ok. So, let’s take a million US dollars invested in the Nikkei when it was 10,000 and the US dollar bought 75 yen.
A million US dollars sold for yen at 75 -75 million yen. The 75 million yen buys 7,500 “units” of the Nikkei-225 at 10,000 yen per unit.
Skip forward a dozen years and those 7,500 units are worth around 40,000 each for a value of 300 million yen. A quadrupling! But now let’s return that to the US at the prevailing exchange rate of 155 yen per dollar. We have US$1,935,483 dollars after 12 years. Almost double the 1 million bucks we started with. The compounded annual rate of return is 5.7% p.a. for 12 years. Doesn’t look quite so impressive!
Now consider that since 2012 the DJIA has increased from around 12,600 to 38,500 with an annual compound rate of return of 9.8% per annum for 12 years and the Nikkei-225 return is 4% per annum lower.
All because of the falling yen.
So, here’s the thing. Overseas stock markets consist of two distinct risks – the stock market itself and the currency. When the currency falls, the stock market rises – reflecting the increase in value of overseas earnings as the currency falls – and vice versa.
It used to be that – without central banks playing God – a country with a trade surplus would have a strong current – reducing overseas demand for its products as they became more expensive. Similarly, a country with a trade deficit would have a weakening currency to make its gods and services more attractive to foreigners. Not anymore.
Yak an extreme example – the Swiss National Bank (SNB). Upwards pressure n the Swiss franc made Switzerland exports less competitive so the SNB “intervened” to “stabilise” the Swiss franc – then it intervened some more, then some more – printing Swiss francs out of thin air and selling them for dollars, euros ad other currencies.
Although it lost 86 billion Swiss francs on its “investments” over 2023, it still had 795 billion lefts. Not bad for a little country of 8.5 million people, right? All from the proceeds of fiat currency, forcing trade deficits on other countries so it could protect exports and maintain a trade surplus!
Switzerland Trade Balance 1960-2024 | MacroTrends
“Switzerland trade balance for 2022 was $112.14B, a 11.91% increase from 2021. Switzerland trade balance for 2021 was $100.20B, a 110.84% increase from 2020. Switzerland trade balance for 2020 was $47.53B, a 32.79% decline from 2019. Switzerland trade balance for 2019 was $70.72B, a 7.42% decline from 2018.”
All those competitors elsewhere can just suck dirt, right?
Here’s a link to the Swiss National Bank balance sheet.
Annual financial statements and profit | Swiss National Bank (snb.ch)
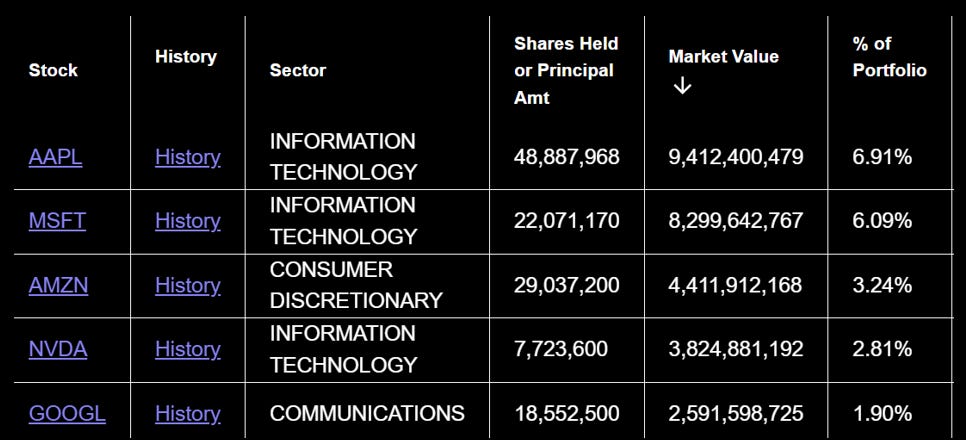
Here’s the top five holdings of the SNB:
As I said, the Swiss National Bank is just one “entity” that distorts the pricing of goods and services in its favour.
Check out the Bank of Japan’s from here:
Bank of Japan Accounts (April 20) : 日本銀行 Bank of Japan (boj.or.jp)
592,614,405,753
(thousand yen)
Japanese government securities
600 trillion yen in Japanese Government Bonds (JGB’s) = around 4 trillion US dollars’ worth – out of a total “fiat currency” balance sheet of 757 trillion yen. The US “fiat currency” valance sheet is here:
6.8 trillion bucks of funny “fiat” - 1.7 times the size of Japan’s – the US has 338 million people to Japan’s 122 million – 2.7 times.
Other central banks, notably the EU and China have similar balance sheets. Sort of makes you wonder what the world would look like if they simply cancelled the government debt on their balance sheets OR managed their balance sheets with country Treasury departments in such a way as to reduce national debt!
For Japan, you would think that house prices would be falling fast, 3 million fewer people implies around 1 million empty homes and rising fast!
Quite the opposite!
Japan's Real Estate Market Trends in 2023 - PLAZA HOMES (realestate-tokyo.com)
“As the table shows, the 2023 Japan’s real estate price index is on an upward trend for both residential and commercial land, and it is estimated that the upward trend will continue in 2024 due to factors such as the rising cost of building materials and the inflow of investment money from foreign investors.”
Uh huh.
Ok, that’s enough. I will sign off with a final point.
All that yen currency risk ca be removed, and you will get PAID to do it. The interest rate differential between the US dollar and the yen is around 5% - which means that you can sell yen one year forward to buy US dollars at 5% BELOW current “spot rates” of 155 yen per US dollar. Do that for a few years with the yen weakening at its current rate and you will keep lots of gauss from the Nikkei-225 AND rack up an extra 5% per annum hedging out that currency risk. Remember though, that if the Bank of Japan starts raising interest rates (it is several years “behind the curve”, the Nikkei-225 will tumble and the ye will rise – meaning you will be left with a cash shortfall each time you “roll” your forwards (that is “settle” the profit/loss on the roll-over date)!
Onwards!!!
Please subscribe ten dollars a month or annually for 100 bucks. You can also donate via Ko-fi – any amount from three dollars upwards. Ko-fi donations here: https://ko-fi.com/peterhalligan
Good article! (PS ... you need an editor '-)
Take a lesson..this will be us soon.