

More data doodling – US Death rates 2013 to 2023 - by gender. age cohort and overall– data problems in 2022 and 2023 miscounting 300,000 deaths?

Regular readers will be familiar with this chart of death rates taken from here:
United States Deaths 2024, How Many Deaths in United States 2024 | Dead or Kicking

The red line represents the clear (+16%) increase in the rates of deaths per 100,000 for the US since the scamdemic was perpetrated.
The compiler of the data has done a great job presenting the data. Data exists going back many years at the overall level as well as by race, gender and age, making “crude” analysis possible for more detailed investigation.
Here are some tables taken from the website for annual Death Rates per 100,000 population (first column) and Birth Rates from 2013 to 2023.
Deaths are from the dead or kicking web site – births from the CDC web pages and expressed per 100,000 using the same population denominator.

Convergence!!!
You can clearly see the step up in deaths per 100,000 in 2020 – which has NOT abated in 2023 when deaths with C19 present had fallen back to 70,000 – around 21 deaths per 100,000 of the US population.
There may be an issue with the numbers for 2022 and 2023 (see below) where around 100,000 deaths in 2022 and 200,000 in 2023 remain anomalous when cross checking with the age cohort totals from “dead or kicking”.
Leaving that aside for the moment, the change of an extra 200 deaths per 100,000 between 2013 and 2021 is startling. An increase from 820 to 1,020 = almost 25%.
Similarly, there has been a steady decline in the number of births per 100,000 of the US population. 2021 registered 140 fewer births per 100,000 compared to 2013.
The surplus of births over deaths has declined from 420 per 100,000 in 2013 to around 60-70 per 100,000.
For the eugenicists out there, this means that without illegal immigration, the US population would be broadly stable with no population controls needed beyond those already in place.
For those interested in the underlying numbers here they are:

The far-right column adds deaths, takes away births and “population growth” to come up with a proxy for net migration.
Here’s a quick look at death rates by gender (just two genders!).

Now why would death rates per 100,000 of each of the male and female populations (population numbers are discretely shown on the dead or kicking website) have increased by 12% for women since 2013 and by 33% for men?
Interesting how the death rate for men increased in the first year (2021) of the C19 injections while that for women declined!
So, here’s a breakdown of raw numbers of deaths per age cohort – where the 100,00 additional deaths for 2022 and 200,000 additional deaths for 2023 (that is, the overall numbers are 300,000 LOWER than the components) is revealed.
From the same data source – “dead or kicking” – we have these raw numbers of deaths.

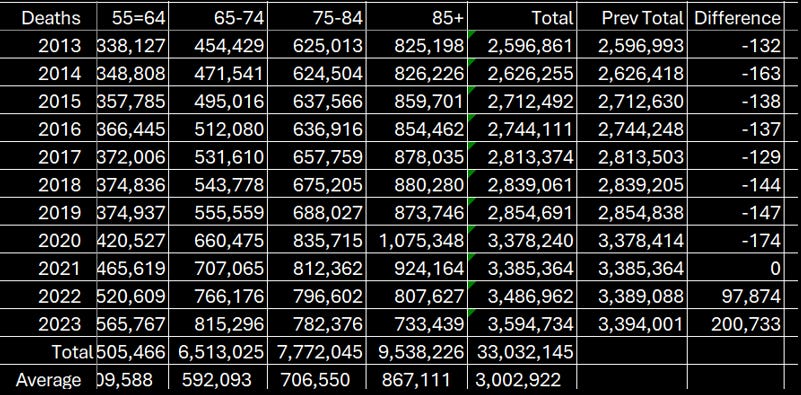
The sum of each age cohort corresponds to the stated total deaths (at the top of the page) except for 2022 and 2023 where summing the age cohorts exceeds that previously stated total at the top of this page by 100,000 for 2022 and by 200,000 for 2023.
Which makes the calculation and comparison of death rates over the years problematic!
The data up until 2021 inclusive looks ok, so we can at least check that out and see what we can glean. Check out the increases in death rates in the 25-34 and 35-44 year old cohorts. Here’s the death rates for the 35–44-year-olds:
2020 2019
The increase in deaths in the 85+ age group in 2020 is shocking.
2020 2019
You can scroll over these links for each year to get the numbers immediately above.
United States Deaths in 2019, How Many Deaths in United States 2019 | Dead or Kicking
United States Deaths in 2020, How Many Deaths in United States 2020 | Dead or Kicking
Just change the year at the right-hand side of the link to get to the year of your choice.
A twenty per cent increase in the death rate in 2020 per 100,000 followed by clear evidence of a pull forward effect in subsequent years (albeit 2022 and 2023 to be confirmed).
A similar effect was seen in the 45 years and older cohorts but not much in younger cohorts.
How large was the impact of the mass deaths in New York in 2020? How about correlations of treatment protocols in medical settings with Remdesivir and fentanyl (or Midazolam plus morphine if numbers like these are available and similar?).
Until we can reconcile the totals at the top with the sum of the age cohorts in the above tables, it is not possible to analyse deaths per age cohort. Either there are errors across the board if the age cohort numbers for 2022 and 2023 or the deaths for 2022 and 2023 are understated by around 300,000.
Unless the website compiler of “alive or kicking” or the sources of data changing methods, there is no obvious reason why all annual numbers up to and including 2021 should reconcile but not numbers for 2022 and 2023. Even late filings for 2023 should be available by now.
As it is, you can see why the insurance companies wet their pants over numbers for 2021 (and have been sworn to silence for 2022 and 2023???) for the younger age cohorts. (Emphasizing these numbers are subject to verification,)
Have the number of deaths in each of the 25-34 and 35 44-year-olds really doubled? What should public health authorities learn from data like this? Well, the data reveals that for younger age cohorts (below 55) there never was a pandemic – this could have been monitored every week to confirm over the first two years of the pandemic.
Similarly, the treatment protocols for the older age groups should have been reviewed each and every week.
And all this even before a reconciliation of extra deaths with “vaccines” is taken into account – with a check for the number needed to vaccinate, life years saved or lost, deaths/injuries per thousand doses compared to the randomised clinical trials were studied.
Onwards!!!
Please take a paid subscription or forward this article to those you think might be interested. You can also donate via Ko-fi – any amount from three dollars upwards. Ko-fi donations here: https://ko-fi.com/peterhalligan
Spellcheck, please. “...the eugenicists out three, this means...” out there?
Peter
Gender and sex are not synonyms.
Sex is an anatomical description. There are 2 sexes, male and female (nouns).
Gender is a taxonomic term to classify nouns in Indoeuropean languages. There are 3 genders, masculine, feminine and neuter (adjectives meaning like a male, like a female.) The word gender was adopted by the psychosocial literature to describe the state of mind of those who believed themselves to be the opposite sex. So a man dressing and living as a woman was stated to have feminine (female like) gender but male sex and visa versa.
A case of a man showing up at work dressed as a woman was fired. The case went to court as "gender discrimination" and the judge ruled against the plaintiff as Civil Rights law does not mention the word gender. It forbids sex discrimination and not gender. This is why Biden wishes to add this to the law.
The political left wants these 2 words to be confused with each other so that it becomes part of the vernacular, which will allow them to get this legilation that they so dessire. Please don't assist them and remember that there are 2 SEXES and 3 GENDERS - that has been expanded to >50 by now.