NZ big picture backdrop for the mortality data leaked by the whistle-blower - a quick look at adverse events reporting on New Zealand’s Medsafe system - 60 missing kids reports from NZ to VAERS
We are watching the “push me pull you” of the mortality data from New Zealand.
The solution is simple, locate a representative placebo (or use five years of 2015-2019 as a baseline), show the numbers and dates of death since 1 January 2020 – do the same for the vaxxed along with their injection dates for each dose.
Break down by calendar year and make sure these numbers add up to total deaths over the period!
The mortality data is available to all and simple to get from NZ databases, medics were paid per dose with name and date from the whistleblowers 4 million records – the other 8 million exist as well.
Data miners/analysts can do all the heavy lifting and are ready to get to work.
A quick sidetrack to the Eagles post today showing that 60 child events were obfuscated by not including or even deleting the ages of children suffering – events reported to VAERS from NZ.
Read all about it here:
(100) P8 BOMBSHELL!: New Zealand Data - VAERS Is Running Cover For NZ MOH! (substack.com)
Ok, here are a couple of snapshots of screens I have been able to track down on adverse reactions. It looks like these have not been updated since November 2022, or maybe they exist somewhere else. Just like the adverse event reporting systems in the US, Europe, UK, Canada and Australia, they are a pig to navigate and are NOT written in such a way that facilitates the extraction of data. Pretty appalling really. Perhaps data miners know how to get to the raw data and use something like SQL or the like that I used decades ago!
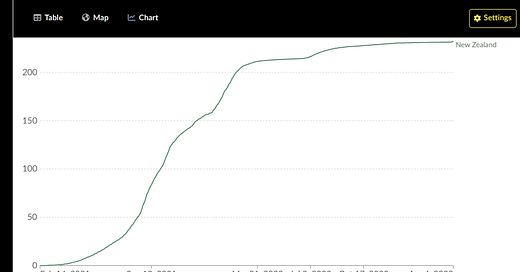
Some context – first “doses” – NZ’ers ceased injecting the poison by early November 2022.
Coronavirus (COVID-19) Vaccinations - Our World in Data
C19 cases and death – showing that if you quarantine both NZ main islands and impose a curfew, nothing happens – good or bad – then a huge “outbreak – with 5,000 deaths with C19 present once you release people from prison. Note the doses administered in the above chart omits the first year of the scamdemic, 2020, otherwise you can lay the above chart onto the charts of cases and deaths below.
Total C19 deaths for NZ to date = 5,143 deaths amongst around 2.5 million “cases” for a case fatality rate of around 0.2% over four years of the scamdemic or the three years of “escape from Wellington” post lockdowns. Call it 0.07% case fatality rate per annum.
Here’s a table of EXTRA, not excess, deaths that use the 2015-2019 period – natural disasters and atrocities included, ignores the massive immigration numbers over the full period – by age bucket- for the 2020-2022 period inclusive (annualizing mortality date to September 2022) – others may have a similar table updated with actual 4q2022 and 2023 data.
Eight thousands extra deaths up to end of 2022.
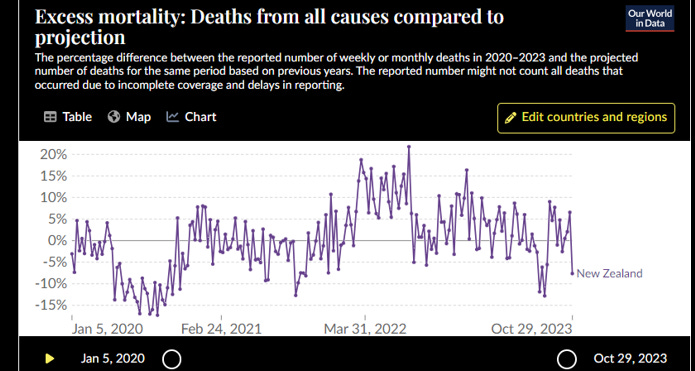
Here is a chart of excess deaths as calculated by OWD
Excess mortality: Deaths from all causes compared to projection (ourworldindata.org)
Looks to be around 20% for 2021 and 2022 – which , with an annual mortality rate of 0.75% = 37,5000 total deaths a year = 75,000 over those two year and works out at around an excess of 15,000 excess deaths over those two years.
15,000 excess deaths. So there are almost double the “extra” deaths I worked out. Just goes to show how the numbers can change depending on whether you are dealing with garbage in ,garbage out or a particular lens.
You can compare these figures to figures for the US for 2021 and 2022 that showed around 1.1 million extra deaths – US population is around 66 times bigger than the US, so 528,000 “extra” deaths over those two years or around 1 million excess deaths on a pro-rata basis.
Ok, that’s the backdrop of the injections, cases, deaths and extra deaths in the “official record” over the period of the scamdemic.
The tables below show numbers just for Pfizer – Modera (Novavax?) and Astra Zeneca data is in there somewhere. Note that deaths are not reported separately in the summaries shown. From the Pfizer Phase 3 clinical studies that ran for a few months in 2020, the ratio of serious (life threatening) adverse events to deaths was around 5 to 1.
December 2021 report here:
Safety Report #39 – 31 December 2021 (medsafe.govt.nz)
So, for 2021 4.2 million Pfizer doses administered – which using Denis Rancourt’s rule of thumb of one death per thousands doses (his team’s work was based on 17 Southern Hemisphere countries) implies that there would have been 4,299 deaths.
You could apply an under reporting factor – just to the serious (life threatening) events of 2,015 – 30 times would be 60,000 events, rather than 2,000 and 40 generates 80,000.
That’s only for 2021 to put down a marker. Now for the latest data available to November 2022.
Safety Report #46 – 30 November 2022 (medsafe.govt.nz)
11.9 million doses – 1 in 1000 doses = 11,900 dead. 3,688 serious events = maybe 100,000 to 150,000 life threatening events over the 2021 to 2022 calendar years.
How many of those serious events are now deceased? Does the NZ MedSafe system have a public and a separate private database of adverse evenrs like the Australians and US regulators have? “Tune in next week” in this soap opera of obfuscation and censorship as people try to get detail on the data they paid for.
Almost in the middle of my “extra” deaths of 8,000 and the 15,000 excess deaths for 2021 and 2022 interpolated using the Our World in Data!
Side note: Using this function you can find the approval; dates for the most recent Pfizer/BioNTech injection approvals:
Product/Application Search (medsafe.govt.nz)
Clicking the top one once you get to the website and type in Tozinameran into the active ingredients field gives you the “product detail”.
Onwards!
Please subscribe or donate via Ko-fi – any amount from 3 bucks upwards. Don’t worry and God Bless, if you can’t or don’t want to. Ko-fi donations here: https://ko-fi.com/peterhalligan - an annual subscription of 100 bucks is one third less than a $3 Ko-fi donation a week!


Hi Peter, you may want to check out the review by the Midwestern Doctor, either on his or use a link from Steve Kirch's substack. Clear as day, this is a democide of the 65 and over group. You do not want miss this! (stratification, anyone without looking at that could be off in the rough.)
Excess death in NZ above the 2015 - 2019 mean for the period 2020 - 2023 (current) ~ 12,000.
For Australia it is around 55,000. Nota bene: New Zealand and Australia have followed each other in near perfect concordance of excess deaths since 2020, and these follow an inverse relationship to Sweden. Whatever is going on downunder, (and it is not a "phantom virus") is not taking place in Sweden. https://drlatusdextro.substack.com/p/if-you-could-read-my-mind