Sickening Asian Tigers indicate there is Big Trouble in the Big Chinese Dragon. Using Asian Tigers treatment protocols might have saved almost a million American lives
(Warning, you may have to click the bottom of a Gmail in order to see all of this post).
I show below an estimate of the number of cases and deaths in China – using Taiwan, Singapore, Hong Kong, Viet Nam and South Korea as proxies.
Here is a table that infers the possible number of cases and deaths in China, using case and death data from five “tiger” neighbouring countries on the WorldOmeter site
I have shown “active cases” rather than cumulative “cases” to reflect the current state of play. The numbers reflect the 96% recovery rate over the 15 days of the average “case”.
Out of interest, Japan’s 125.6 million population has 5.2 million “active cases” (41,661 per million – comparable with Hong Kong) and 51,829 deaths (423 per million – lower than the proxy basket of “tigers”).
Before returning to developing the “basket” v China narrative, note the deaths per million of the basket compared to the USA. US deaths per million are SIX TIMES HIGHER than deaths in the basket of 5 Asian geographies. Or, to put it another way, deaths in the basket are 84% lower than deaths in the US.
This supports the case that US deaths with C19 present were caused by medical negligence/malpractice combined with neglect of the poor, weak and elderly in the US, by, for instance, denying these people continued or new treatments with antibiotics.
Had the US “enjoyed” the same fatality rate as the basket of “tigers”, instead of 1.1 million US deaths, there would only have been around 180,000 deaths – implying that US treatment protocols cost almost a million deaths compared to the countries in the proxy basket. If anything, NPI (non-pharmaceutical interventions) measures were more severe in the basket countries compared to the US, so these probably served to increase the number of Asian dead.
Back to the comparison of the proxy basket with China.
The 5 countries in the proxy “basket” have 13,389 “active” cases per million population, which, if applied in the same proportion to China, implies that there are around 19.4 million “active” cases in China. Using the same methodology, the inferred deaths stand at around 780,000 on a cumulative basis.
If Hong Kong is used instead of the proxy “basket”, there would be around 60 million “active” cases in China and around 2.1 million deaths – around 3 times higher!
The vast majority of cases and deaths in the basket occurred from 31 January 2022 onwards. The basket had a “good pandemic” relatively speaking, compared to the west.
How relevant are cumulative deaths since the start of the pandemic to these countries/colonies?
Well, there has been a massive blow out in cases and deaths since the start of 2022.
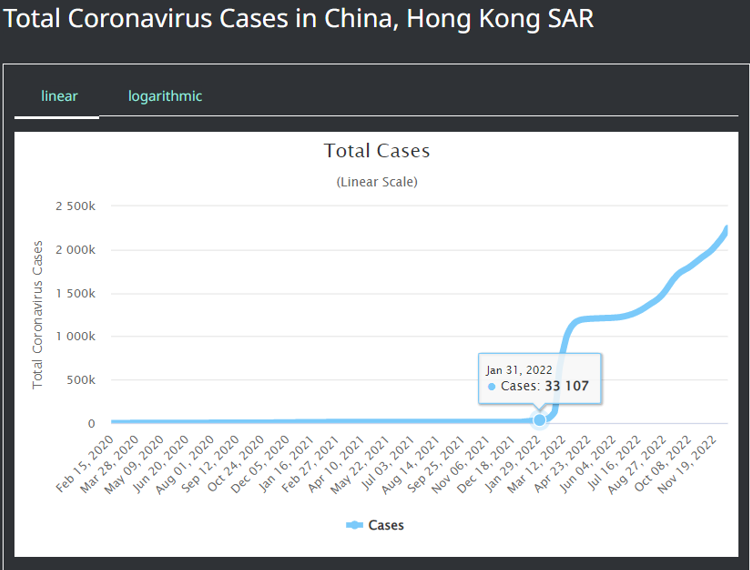
Here are “active” cases from two of the “basket” geographies - South Korea and Hong Kong - which highlights the complete failure of “vaccinations” and NPI’s to prevent “cases” (using the discredited RT-PCR test).
Nothing to speak of until the end of January 2022.
Here are deaths in the two geographies:
Although very low by western standards, cases and deaths amongst the Tigers suffered quite the spike (sic)!
Here’s a chart of the injection roll-out from OurWorldinData for the proxy basket plus the US - there is no data for China – showing percentage of total population (including children) that have received at least one dose.
Hong Kong population dosage trailed a little by end January 2022, but the other countries showed around 80% or above fo the whole population (maybe 20% are under 15 years old?
Bottom line: China may already be suffering from the shock of tens of millions of people testing positive, (or may be about to!) especially as China might be using the same 35-40 amplification cycles to detect the presence of (mostly inactive) viral fragments.
However, new “cases” in the other 5 countries in the tiger proxy basket do not indicate any slowing of their rate of increase and even the comparatively lower rates of death with C19 present will be a shock to the psyche of those countries.
This implies that “cases” will rise further as well.
More proof, if any was needed, that C19 injections actually increased the “case” rate AND the number of deaths, compared to the C19 pandemic itself.
As for “vaccine” harms – I need data sources! I have not located any under-reporting factor discussions or nailed the authoritative official sources (feel free to point them out).


Again this data is the written history that covers the incompatence of government. It is time to make changes. Many believe we cant. weare not controled by our constitution. it is time to reserect the referendum. propose a law and have each state vote for it. -------- I, Grampa
The flaw in the entire article is that you use the reported Covid death rate. For the US, that number is entirely useless. Not only did the US government provide financial rewards for reporting deaths as Covid. (Check the CHS Covid disbursements to find out how strong that was) precisely when hospitals were shut down for ALL discretionary procedures and therefore facing finacial crisis, they also for the first time in US history redefined the way deaths are recorded. They also took that recording out of the hands of the doctor and put it into the hands of administrators.
So don’t believe the US numbers.