

Some notes on electricity prices over the last ten years in the US, three-mile island nuclear plant purchase by Microsoft, some definitions used in “electricity world” and “renewable wind and solar”

A quick update on the reconciliation of natural gas prices on the futures market with natural gas charged to US households. I emailed the EIA and after asking “which publication I was referring to”, there has been silence.
Using Brave, here are average US household electricity prices over the last ten years.
2014 – “averaged 12.3 cents per kilowatthour (kWh) for the first half of 2014, representing a 3.2% increase”.
"2019 – “The average residential electricity price in 2019 was 13.01 cents/kWh, a slight increase from the previous year.” – there was a cold snap in the north-east and natural gas prices increased.
2024 – “As of September 2024, the average residential electricity price in the United States was 16.41 cents per kilowatt-hour (kWh)”.
Natural gas production: “25.7 trillion cubic feet (2014) → 28.8 trillion cubic feet (2015) → … → approximately 43.5 trillion cubic feet (2024). Based on this estimation, natural gas production in the US increased by approximately 17.8 trillion cubic feet (68.5%) between 2014 and 2024.”
Wind power: “Capacity growth: The total installed wind capacity in the US increased from approximately 65,000 megawatts (MW) in 2014 to around 148,000 MW in 2023, representing a growth of 83,408 MW or 130%. Generation growth: Wind power generation in the US grew from approximately 100 billion kilowatt-hours (kWh) in 2014 to around 243 billion kWh in 2023, representing a growth of 143%.
Here’s Brave’s response to the difference between MW and MWH:
“MW (Megawatts):
· Measures the rate at which energy is generated or consumed (power)
· A unit of power, not energy
· Examples: power plant output, electric motor rating, or household electricity consumption
MWh (Megawatt-hours):
· Measures the amount of energy consumed or generated over a period of time.
· A unit of energy, not power
· Examples: daily energy consumption of a household, energy output of a power plant over 24 hours, or energy stored in a battery
Ok, so wind turbine capacity doubled over the last ten years to around 150,000 MW in 2024, whilst generation more than doubled to 243 billion kWh over the same time frame.
Seems odd! 150,000 MW capacity for an hour is 150,000 MWh = 150,000,000 kWh – 150 million kWh compared to 243 billion kWh in generation!
Here’s the Brave AI response to solar power generation:
“US Solar Output 2014-2024 Growth
According to the provided search results, in 2014, utility-scale solar generated 12,303 gigawatt-hours (GWh) of electricity in the US. In 2023, solar power generation in the US reached 238,121 GWh, representing an increase of over 1,840% (or nearly 19-fold) over the 10-year period from 2014 to 2023.
To put this growth into perspective, the US generated enough solar electricity in 2023 to power the equivalent of more than 22 million average American homes, as stated in the search results. This significant increase in solar power production is a testament to the rapid expansion of the US solar industry over the past decade.
Ww! 240,000 GWh = 240,000,000 MWh = 240,000,000,000 KWh (240 billion KWh) – enough to power 22 million US homes out of the 144 million homes in the US!!!
The same generation number as wind! (I smell an AI rat!)
These answers are subject to whatever limitations Brave AI has – they look like they are produced with “green-tinted” EIA numbers.
Otherwise, wind and solar are powering 44% of US households. albeit at much higher prices.
Remember that natural gas power stations are producing more than ever and were powering a significant percentage of US households through the last ten years.
Here’s some definitions of key metrics in the energy business:
· According to the US DOE Energy Information Administration/Electric Power Annual 2022 files, the total US consumption of electricity in 2022 was 4,271.88 terawatt-hours (TWh).
· Baseload Power: The minimum amount of electric power needed to be supplied to the electrical grid at any given time. It refers to the steady-state power demand that remains relatively constant over a period, typically
· The concept of baseload power has evolved with the increasing integration of intermittent renewable energy sources, such as solar and wind power, into the grid. Baseload power plants are still necessary to provide a stable foundation for the grid, but their operation is now influenced by the variable output of renewables. In some cases, baseload power plants may need to adjust their output or even pay to keep their turbines running during periods of low demand, as seen in the examples provided.measured in hours, days, or weeks.
Ok, so as wind and solar shut off (at night or when the wind isn’t blowing), the minimum demand has t be met by other sources. Inversely, when the wind is vowing hard and the sun is shining, the other sources of power need to be shut down (except nuclear and hydro which are always on?).
It looks like every MWh generated by wind and solar reduces the demand from “traditional” hydrocarbon and other sources – whilst every MWh NOT produced requires “cranking up” of “traditional” energy sources. How is this not simply a doubling up of energy supplies – in case wind and solar do not provide energy?
Come to think of it, just how variable is wind and solar? There is hardly ever a constant “ideal” wind at all times for wind. If there is a lull of a few minutes or hours, alternatives have to be fired up. Same with solar.
This all feeds into the minimum power output of natural gas and coal – before they crowd out nuclear and hydro – which in turn are crowded “out or in” depending on the weather! I would bet that wind and solar will provide zero output in areas of natural disasters like hurricanes!
So, why isn’t electricity FREE to households when the wind is blowing just right, and the sun is shining???? The hydrocarbon power stations must be idling or “flaring off” unwanted energy into the air?
Out of interest, here is a link to an EIA site that provides the “levelized costs” of different energy sources and storage costs. It works n the basis of 6.5% opportunity costs for a 30-year period for each type of energy.
Levelized Costs of New Generation Resources in the Annual Energy Outlook 2023 (eia.gov)
It has charts like this (the diagonal line is simply cost generation estimates against “Levelized avoided cost of electricity (LACE) is an estimate of the revenue available to that generator during the same period.”
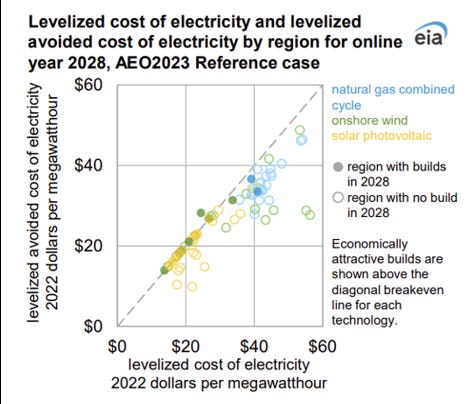
Hence my enquiry to the EIA asking for a reconciliation of the natural gas futures price of 3 bucks for 10,000 MMBTU = around 3,000 MWh for three bucks!!!
The EIA is ether rolling its eyes at my naivete or cannot answer the question since it would blow all its assumptions out of the water!
Lastly, it is within the law to provide your own energy. So, you can go out and dig up some coal and chop down your tree to generate power – provided you meet local regulations on emissions etc.
Microsoft is doing this with its purchase of Three Mile Island nuclear power plant with an agreement to pay around 100 bucks per mWh for 20 years – compared to the average US household paying 16c pr kWh or ONE HUNDRED AND SIXTY bucks per MWh (and which by my reckoning should be a fraction of a cent per kWh!).
My bet is that MSFT agreed to pay closer to 50 bucks than 100 bucks!
Total US energy consumption was around 4300 TWh in 2022 – what’s the betting that AI will demand half that within a few years? And it has to be “always on”.
Renewables can’t supply “always on” power – so either “Net Zero” is abandoned or China takes the lead in AI and all other power-hungry tech (like video surveillance with algorithms to beep the naughty folk!).
Onwards!!!
Please take a (paid or unpaid) subscription or forward this article to those you think might be interested. You can also donate via Ko-fi – any amount from three dollars upwards. Ko-fi donations here: https://ko-fi.com/peterhalligan