

A finger on the pulse of USA death rates in 2023

With news emerging from Japan of a NINTH wave of C19, despite Japan being one of the most heavily injected countries in the world (and it NOT being ‘flu season) I thought I would check the pulse (do a little grave digging?) amongst some of the preliminary mortality numbers being reported.
Regular readers will be familiar with this chart, showing the step increase in mortality in the USA over the calendar years 2020, 2021 and 2022.
United States Deaths in 2022, How Many Deaths in United States 2022 | Dead or Kicking

Denis Rancourt shows that there was no pandemic. Deaths reported as C19 were in fact due to lack of treatment (especially with antibiotics and antivirals) and diagnosis, death by healer (denial of sustenance, use of respirator bacteria factories, known killer drugs like Remdesivir and, of course, the single biggest killer – experimental and poorly manufactured C19 mRNA injections.
Note that there has been no “official” explanation of the step increase in mortality of 560,000 A YEAR, despite the rapid decline in (falsely) attributed C19 deaths that might have been leapt on by health regulators to explain such an increase as “long C19”.
Heaven forbid that analysis of the relative vulnerability of around 6 million illegal immigrants over the last 3+ years should be undertaken (let alone the presence of other diseases and health conditions treated with US tax dollars!)
At least 90%, maybe 95%, of deaths attributed in the official statistics to C19 should correctly be attributed, not to C19, but to other (leading) causes – and the contributors to these causes of deaths further analysed (e.g. lack of antibiotics, use of Remdesivir).
Using the same data source, and acknowledging that all data is preliminary, check out this chart of weekly deaths over many years.

Looks more than a little cyclical – perhaps someone has “de-trended” the cyclical nature of this weekly chart to reveal underlying data changes. Maybe they haven’t. I haven’t seen any work of this sort.
Anyway, here is a table that uses that chart as a source to compare Weeks 12, 23 and 40 for 2020, 2021, 2022 and this year, 2023.
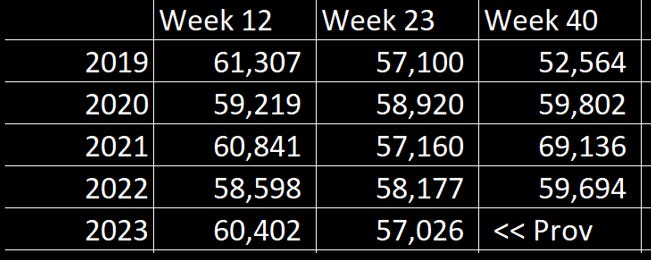
My eyesight is NOT improving, so there may be some “squinting” errors as I attempted to differentiate between the three different “death” values for each week.
Hardly any differences to speak of – EXCEPT for week 40 of 2021 AND less so but still significantly higher than 2019, for week 40 of 2020 and 2022.
What on earth happens in Week 40? Is there a switch in suppliers or processes of the mRNA ingredients or their methods of aspirating injections in different States?
As for 2020, was there a much higher use of Remdesivir or another C19 specific factor? There were around 100,000 C19 deaths (mis-)diagnosed over the third quarter of 2020.
For 2021 weekly deaths were 16,600 above 2019 and 9,300 above 2020. Multiply by 52 to annualize.
Interestingly enough, over the period from end May 2021 to end September 2021, around 100 million C19 mRNA injections were administered in the USA. Of course, we don’t know how the ingredients in those 100 million doses differed from the prior or subsequent 100 million doses. That is information that, probably, nobody has because no-one anywhere in the supply chain through to the shot in the arm knows either.
What we really need to know is the “pipeline” of developing diseases and conditions.
Perhaps, in many places, the return to normal diagnostic testing for non-C19 conditions returned in the summer of 2022. Maybe it didn’t – I have no clue. One corollary of the C19 mRNA injections is the detection and treatments now required. If there has been no worsening as a result of the toxic injections, we can heave a huge sigh of relief.
Otherwise, there are a millions upon millions of ticking time diseases and conditions waiting to be diagnosed.
Onwards
Please upgrade to paid, or donate a coffee (I drink a lot of coffee) - “God Bless You!” if you can’t or don’t want to contribute. Coffee donations here: https://ko-fi.com/peterhalligan Buying just one Ko-Fi a week for $3 is 50 bucks more than an annual $100 subscription!
Hi Peter, don’t know if you know this guy but he seems pretty bright and thought you may be interested in his YouTube channel. https://www.youtube.com/@Merogenomics
Love your newsletter, thanks much
Yes there are millions of ticking time bombs walking the planet. This piece of research is the beginning of the breadcrumb trail. I was very fortunate to know prof Vera Stejskal and she helped me through my first implant allergy.
How we respond to metals dictates how we respond to other chemicals in the environment and implant allergy patients all over the world validate this research everyday with their experiences.
It’s why we all react differently to flus and to vaccines and to everything. It’s why some people have long healthy lives and why some have shorter unhealthy lives
Vera was a threat to the pharmaceutical industry. Their biggest fear is that it will become well known that how we respond to metals dictates our lives and people will stop taking all pharmaceutical products including vaccines.
Because their products all have metals in them. And those metals make us respond to the environment and get sick depending on our sensitivity.
Vera has more research which backs all this up. It was her life’s work. But here is the beginning of the breadcrumb trail to how big pharma profits off our I’ll health.
The human body has no value unless diseased but if you avoid metals from birth you will have a long healthy life. Just like the Amish do.
https://pubmed.ncbi.nlm.nih.gov/11460087/