

Deaths with C19 present were around 4-5% of deaths amongst the elderly in New Zealand-increases in rates of death per 1,000 in elderly cohorts around 20% - were there more than twice the vaxx deaths?

More data doodling – twin large screens, database management and better eyes required for verification!
See what you think.
New Zealand has suffered a little over 5,179 deaths with C19 present.
Here are the numbers for the elderly age cohorts, taken from here:

455 for 60-69’s, 1,070 for 70-79’s, 1,882 for 80-89 year olds and 1,328 for those over 90 years old.
Those over 60, accounted for 4,735 of 5,179 deaths with C19 present and those over 70 accounted for 4,280 of the 5,179.
I took a look at some raw mortality data for the elderly in New Zealand here:, suggesting that there was an issue with 80-84 year olds.
There seemed to be anomalies with male and female deaths in the 80-84 cohort over the April through August data for 2022, suggesting a significant event. Was it C19 or the C19 injections?
The data was not adjusted for population, so I have gone a little deeper. Not by month of death, but by population per age cohort to get an approximation of the death rate per age and gender per year.
Using data from here for population:
National population estimates: At 30 June 2018 | Stats NZ
And the source for previous mortality data here:
Monthly-death-registrations-by-ethnicity-age-sex-Jan2010-Sep2023.xlsx (live.com)
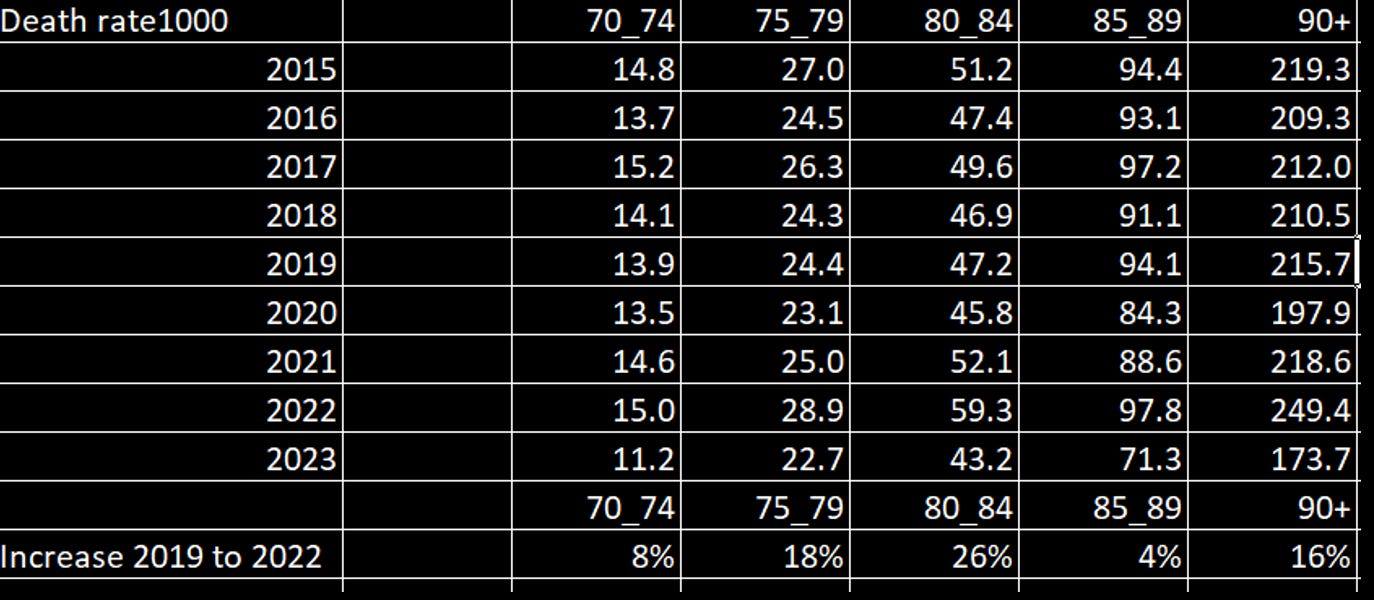
And making the simplifying assumption of using June 2018 population estimates as the denominator for subsequent years – and using a starting population as the denominator where it is available for years 2014 to 2017, I have come up with this table of changes in deaths per 1,000 per elderly age cohort and show them also as the change between 2019 and 2022:
Note the 2023 numbers are to September 2023 – you could scale up by1.333 to annualize, though this would not reflect lower deaths in the spring and start of summer.
Males:

And for the ladies:
Ok, let’s get back to the actual deaths.
From the top of this article we had these deaths with C19 present (we don’t know co-morbidities or the treatment protocols applied).
1,070 for 70-79’s, 1,882 for 80-89 year olds and 1,328 for those over 90’s = 4,280
The total number of deaths
23,073 for 70-79’s, 42,366 for 80-89 year olds and 27,507 for those 90+ = 92.946
A 10% increase in deaths represents 18,000 additional deaths, 20% would be double that.
Around one death in 20 in these elderly cohorts was attributed to C19. 4,280 deaths.
So C19 accounted for around 4%-5% of all deaths in each cohort over the 45 months – 3 years 9 months of the scamdemic. You might drop off a few months until the WHO declared the Public Health Emergency of International Concern (PHEIC pronounced FAKE).
Under lockdown, New Zealand was a prison over 2020 and for the time it took to roll-out injections.
Anyway, the point is the death rate per thousand maybe reduced by the annual deaths with C19 present. Say 3% per annum for 2021 and 2022 – but not 2020.
How much of the leap of 20% in the death rates per 1,000 were attributable to C19 and how much to “something else”?
My bet is that 15% or more of the increase in the rate of deaths per 1,000 is attributable to C19 mRNA injections.
I don’t have the number of doses administered per age cohort, though we can assume that the elderly received the double hit in 2021 and a booster in 2022 – for three shots each for almost everyone over 70?
There were 233,180 people over the age of 70 in New Zealand as at 30 June 2018. Three times each works out around 700,000 doses. Assuming one death per 1,000 doses, you get 7,000 deaths, spread across the over 70’s.
Although the numbers I have calculated require verification via statisticians (like Barry Young!) who are more experienced and qualified than I, the numbers should at least be used as a starting point for NZ investigators and part of submissions to the enquiry into “the National Interest” criteria being undertaken in NZ?
Just to show the workings here are tables that underpin the calculations of rates of death per 1,000 per gender, age and population.


Remember from the past post that most of the unadjusted for population extra deaths occurred between April 2022 and August 2022 for both men and women,
Anyone know when the boosters were rolled out?
Onwards!
Please subscribe or donate via Ko-fi – any amount from 3 bucks upwards. Don’t worry and God Bless, if you can’t or don’t want to. Ko-fi donations here: https://ko-fi.com/peterhalligan - an annual subscription of 100 bucks is one third less than a $3 Ko-fi donation a week!
Hi Peter, this documentary released recently: "Unsafe and Ineffective COVID Vaccines - Plandemic Vaccines Documentary" - - https://rumble.com/v419xmn-unsafe-and-ineffective-covid-vaccines-plandemic-vaccines-documentary.html - - Ed Dowd, Dr. John Campbell, and others have cameo appearances. - - see what you think.
The boosters were rolled out in Feb/March 2022. Just before the increase in deaths