Japan - land of the setting sun – soon to open for migrants from the West with a little money?
Yesterday I posted this piece about the annua changes in population, birth and death rates from 2010 to 2023 – with a comparison of changes in average annual rates before and after C19. It showed solid evidence supporting the “great replacement” theory.
I thought I would check out Japan to see how it compares. Unlike the US, it has an easy-to-use database of statistics on births, deaths and population. After all, Japan does not have an illegal immigration problem, though its population as a whole has had three shots of the mRNA venom compared to an average of 2 in the US.
Its C19 “case” rate is 269,000 per million people with a death rate per million of around 600 – compared t that of the US of 329,000 cases per million and a death rate of 3,557 per million. So, the C19 disease resulted SIX TIMES the deaths in Japan with a slight difference in “cases”.
I know, I know, the US case numbers are bogus and so are the deaths – I am not sure about Japan’s.
This relative death rate does provide clues as to the genocide in the US, Had Japanese medical standards been applied to the US, instead of 1.2 million deaths, there would have been 200,000 – a million extra deaths in the US using per capita adjusted numbers.
Back to Japan – the land of the setting sun.
Here are the sources for the data:
Population, births and deaths up to 2022 – far easier to reference than US, UK and Europe! If anyone has good data with easy access for these and UK, Canada, France, Germany and Italy to get to a G7 comparison, I am all eyes! (We have the US and Japa now).
Deaths in Japan for 2023
Annual Population Deaths by Country in 2023 (World Map) (database.earth)
Live births in Japan for 2023
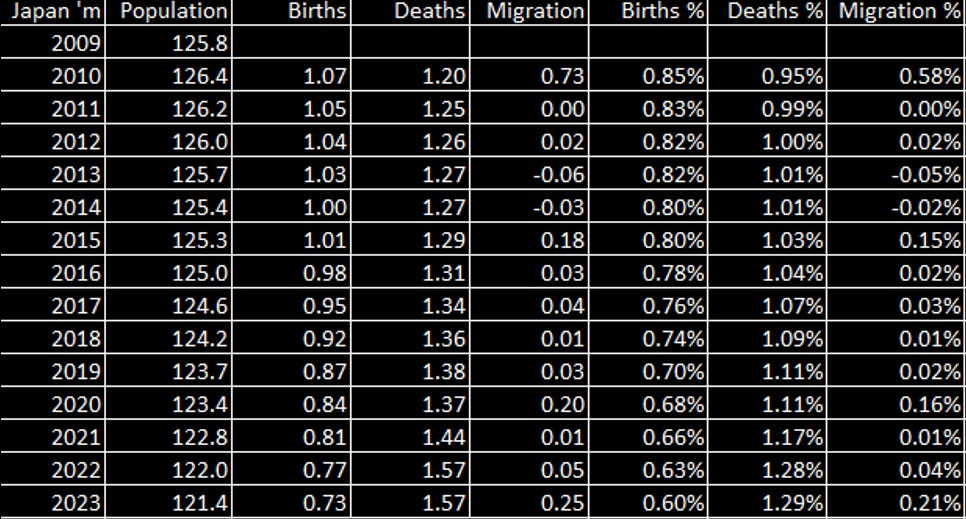
Here is the summary table:
A thirty per cent decline in the birth rate and a 35% increase in the rate of deaths on a point-to-point basis from 2010 to 2023. A comparison of the ten-year average pre C19 to the four years post C19 shows an almost 19% decline in average annual birth rates between the two periods and a 17% increase in the death rate. Tiny numbers and large percentages for migration.
Here is the same numbers for the US:
The US has around half the decline in the birth rate but has a higher increase in annual average death rates between the pre- and post C19 period - albeit with a 26% increase in death rates v Japan’s 35% increase in the death rate point to point for 2010 v 2023.
Here’s a (busy) table of the underlying Japanese data.
Nineteen million deaths and 13 million births – down 6 million since 2010. The us was up around thirty million.
Enquiring minds want to know why the US has been targeted to receive six million illegal immigrants by the UN’s International Organization for Migration (ION) rather than Japan!! Seems to be completely bass ackwards!
International Organization for Migration | IOM, UN Migration
Onwards!
Please subscribe or donate via Ko-fi – any amount from 3 bucks upwards. Don’t worry and God Bless, if you can’t or don’t want to. Ko-fi donations here: https://ko-fi.com/peterhalligan - an annual subscription of 100 bucks is one third less than a $3 Ko-fi donation a week!


Illegal immigrants....
Who would want to live there? Those nuclear reactors are right on the coastline and they keep having major earthquakes. What could possibly go wrong? No thank you.