

Looking inside the Russian dolls of the retirement industry – Part 2 - Target Date Funds – arbitrary benchmarks, high risks, fees and poor long term returns - BUT! bumper 2023 to come!

In Part 1 – I made some comments about annuities – they may be the smallest doll in the Russian doll sequence.

The largest doll can be likened to the US retirement industry that is worth around 27 trillion dollars.
Here’s What the $27 Trillion US Retirement Industry Looks Like | ThinkAdvisor
You will recall that the annuities market was worth around 250 billion bucks.
I was personally involved heading up the research of managers of Target Date Funds at Aon Hewitt Investment Consulting based in Chicago for a few years ending in 2015. So although I am a little rusty, I have first hand and intimate knowledge of the basic tenets of Target Date Funds. The responsibility for this research was part of my role as US Head of Global Fixed Income. I also helped the vastly more experienced team from other divisions of Aon Hewitt in the rating of insurance companies and their “book of business” for annuities.
There are may links that help to analyse the Target Date Fund market, here’s one:
2023 Target-Date Funds and CITs Landscape | Morningstar
Here’s a snippet from the report that can be obtained by filling out the form – even as a private investor.
“Despite 2022’s market turbulence, they garnered $153.3 billion in net flows. But with no place to hide from the stock and bond market downturns, total target-date assets fell to $2.82 trillion in 2022 from its record high of $3.27 trillion in 2021. Market depreciation drove the roughly 14% drop.”
So, the size of this Russian doll is around 11 times the size of the annuity Russian doll.
Adding back the 153 billion inflows to the 3.27 trillion bucks opening 2021 value, and taking away the closing2.82 trillion closing 2022 value – target date funds lost 600 billion bucks over the course of 2022.
Not exactly chump change ,but there has been a significant recovery in 2023 – maybe getting back all of the losses to end up with close to a zero return for the combined 2022 and 2023 calendar years.
After all the S&P500 is up over 24% so far this calendar year.
A Few days ago, I posted this article in the context of ESG.
(100) Some notes on ESG – Environment, Social and Governance (substack.com)
It had this table of the performance of one of BlackRock’s funds – one with full discretion granted to the manager: The fund is the Global Allocation Fund – ticker MDLOX

The benchmark is one that BlackRock constructed that it though best represents the portfolio that will meet long run return expectations of investors. Here it is:
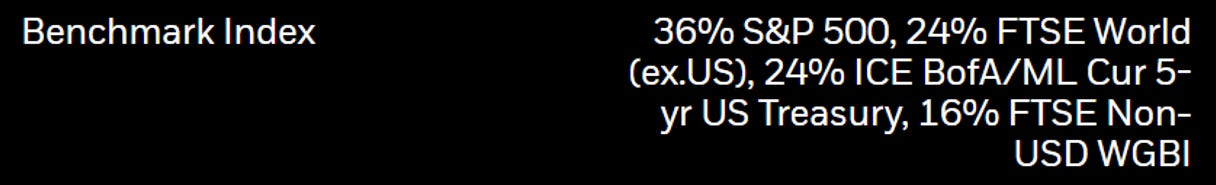
Sixty per cent equities and 40% fixed income – all pretty arbitrary.
I have included a date for the returns – September 2023 – and another row – Morningstar Category Average which is a peer group of similar funds that may or may not have the same benchmark. You can see that BlackRock has not only performed abysmally against its own benchmark, but even worse when compared to the peer group. Both the benchmark and peer group are arbitrary and do not put other important issues into context.
Note that I did not refer to the return after sales charges. These are apparent, but are not directly related to investment performance.
These returns do not reflect the TARGET of the fund. Blackrock is an active manager of this fund and has a TARGET of excess over and above its own benchmark. The target is not articulated I the link, but as a rule it is related to the risk taken by the manager to achieve it. It is usually expressed as a “ex-ante tracking error” – which is a measure of the difference in the historical volatility of a portfolio at a single point in time, compared to the risk of the benchmark at the same point in time.
The higher the permitted risk (ex-ante tracking error) the higher the TARGET return over and above the benchmark. Typically it must remain within a range and the “risk management” skills of the investment manager are compared to this “risk budget” on an “ex-post” basis to check for quality of compliance and conformance.
For this type of fund, it would not be unusual to see a TARGET excess return – per annum – of around 9.75% with an average tracking error of around 1.5% - which gives rise to another important performance indicator called the “Information Ratio” – simply the excess return divided by the risk (standard deviation of excess returns).
In this context, and if BlackRock gave itself this risk budget, the returns are far worse as before even comparing to its benchmark, it has a “bogey” to climb over of 0.75% per annum which must be added to the benchmark return.
For the sake of interest, I show a plain vanilla product that BlackRock also rues – worth 1.5 billion bucks.
The 60/40 Target Allocation Fund – ticker BIGPX (nice ticker branding huh?)

Note the similar Morningstar Category returns for the last 1 and 3 years, the different benchmarks and returns and the different one and thee year returns between these two BlackRock portfolios.
One other point to make – the returns shown in these tables are the investment returns AFTER other fees like custody fees, transaction fees, local taxes and “other charges”, but probably BEFORE investment management fees. More on this later.
Suffice to say, looking at the investment performance before fees, gives you an idea of what the manager is worth. You would be more inclined to pay a manager a fee of, say 0.25% per annum, if that manager consistently delivered a target return of 0.75% per annum, whilst remaining within its risk budget!
Enquiring minds might want to know, not just what the risk budgets ad target returns were for each of these two funds, but why both funds have a benchmark of 60% in equities and 40% in bonds but use different index providers AND why 36% of the 60% in equities is in the US with 24% offshore and why there is only 18% of 60% in US with 42% offshore in the other!
So, now well done for staying the course thus far. I have brought in the concepts of target returns, ex-the “tracking error of ex-post (historic) returns compared to ex-ante (estimated based in current positions) tracking errors and the reward per unit of risk – information ratio.
Armed with this we ca proceed to the main body.
Firstly, there are many investment managers aside from State Street, Vanguard and BlackRock. Vanguard and State Street are predominantly PASSIVE managers whose target excess return over a benchmark is ZERO. Half of BlackRock’s managed funds are also PASSIVE,
These are the big three for the PASSIVE – zero excess return target – fund business.
Active fud managers include the likes of Fidelity, PIMCO, Alliance Bernstein, Capital, Goldman Sachs, JP Morgan, Prudential and many others. These managers have dozens if not 100;s of products EACH, all competing with each other for pension fund and other pools of money to manage. They are all active – though they may use passive funds in some form as part of their portfolios to arbitrage opportunities between and across markets.
Each active manager will have a risk budget and a target EXTRA return, (hence an Information Ratio) permitted investments and fee scale. The extra return per annum is typically of the order of 0.5% per annum with 1.5% risk, but some investors want more and look for an excess return of between 1 and 4% per annum with a risk budget of up to 10%! In general, the higher the target excess return the higher the fee the manager will charge.
Let’s dive into target date funds and use Fidelity’s 2035 fund as an example.
FFTHX - Fidelity Freedom ® 2035 Fund | Fidelity Investments
“Fidelity Freedom® Funds (the Funds) are designed so that the target date referenced in the Fund name is the approximate year when investors expect to retire.”
So this fund is targeting those aged around 50 or so.
Here’s what it invests in:

74% equities – split 39% US and 35% non-US with the rest in bonds/cash. Not much detail.
Maybe there’s more detail here:
FFTHX - Fidelity Freedom ® 2035 Fund | Fidelity Investments
Nope. Well we know the ticker and the amount invested – FFTHX, been around since 2003 and has 9.3 billion invested out of 26.1 billion total invested in the particular strategy – meaning other funds invest in the same assets as this 2035 fund.
Here are its returns:

Not bad, well, except for the annual returns over three years. Forgivable though!
Different end date than the BlackRock funds shown above, those BlackRock funds are also NOT Target Date Funds – so not apples with apples! I am not trying to compare performance across managers here!
What are its holdings?
From here:
Fidelity Freedom 2035 (FFTHX) holdings – Yahoo Finance

The weighted average of investment management fees, excluding any custody fees, trustee fees, transaction costs, local taxes etc (maybe 0.5% to 2% per annum) that reduce the investment return are here:

Bond fund investment manager fees are generally around 0.25%, equity a little more, emerging market equities around 1.25%.
Given the fund has a market value of 9.3 billion bucks and the strategy assets are 26.1 billion - 0.7% investment manager fee comes to 65 million bucks for the fund and 183 million bucks for funds in the strategy! That will buy a few peanuts right?
Ok, the fund is made up of a bunch of Fidelity products. I will look at one of them, but ask yourself what the chances are that Fidelity Maybe it is better, on average across all, maybe it is worst.is the best in the business in each of the sectors above. It may be best in one and worst in others. That’s what you pay consultants for!
Here’s the performance of that Emerging Market Opps fund from here ticker FEMSX:
FEMSX - Fidelity ® Series Emerging Markets Opportunities Fund | Fidelity Investments

Note this proviso “Not available for individual purchase. This fund is provided to clients as an underlying investment in Fidelity Freedom Funds or certain asset management programs.”
A lucky portfolio manager – very important that, every manager needs luck - was appointed in December 2022.
Fidelity Series Emerging Markets Opps (FEMSX) company profile & facts – Yahoo Finance
“,Lead manager since 29 December 2022 - Lewis Chung is the Co-Portfolio Manager of the Fidelity ® Series Emerging Markets Opportunities Fund, which he has managed since 2022. He also manages other funds. Since joining Fidelity Investments in 2010, Mr. Chung has worked as a research analyst and portfolio manager.”
Nice bit of marketing. To get to this fund you must go via the Target Date route!
Not a very good three year return and no mention of the targeted excess return either. I would expect these high risk markets and opportunities they present to require an excess return of 2-3% because of how “inefficient” they are in pricing. Other than that, without checking out every other managers Emerging Market product, there is not much to say!
I would point out though that the ten year annua; return for Emerging Markets equities is an abysmal 2% per annum, compared to the almost 12% return (to close yesterday – not the end dates of 30 September 2023).
Under performance of 10% per annum for ten years, with higher risk and fees that are closer to 1^ than the 0.1% that S&P500 tracker funds like VOO operated by Vanguard,
Maybe this is a “cycle low” in the atrocious performance of Emerging Markets equities v US equities. I can’t help but wonder how much money has been ploughed into emerging markets to support the build out of their infrastructure in buildings, roads, transit systems, telecoms, agriculture etc that could have been spent in the US. This particular Fidelity fund has 22 billion bucks in it.
Remember Fidelity id just one manager investing in emerging markets. There are dozens more I the US and hundreds more in the EU and UK. How much in total has been invested in emerging markets, creating supply shortages of shares and pushing up share prices in the past, until the money dried up in terms of “diminishing returns”? Ten year worth of what a few trillion bucks funnelled offshore to investment managers located on site around the world in emerging countries – being paid double or triple a US based manager?
In this day and age of proxies like BTC that have no underlying value at all, just perceptions of value, how hard would it be to construct a device that mirrors the returns of emerging markets without investing in them directly? Futures contracts on bonds and equities do not require direct ownership, just margining and maintenance of daily p/l margin adjustments!
What are tis emerging market funds’ holdings?
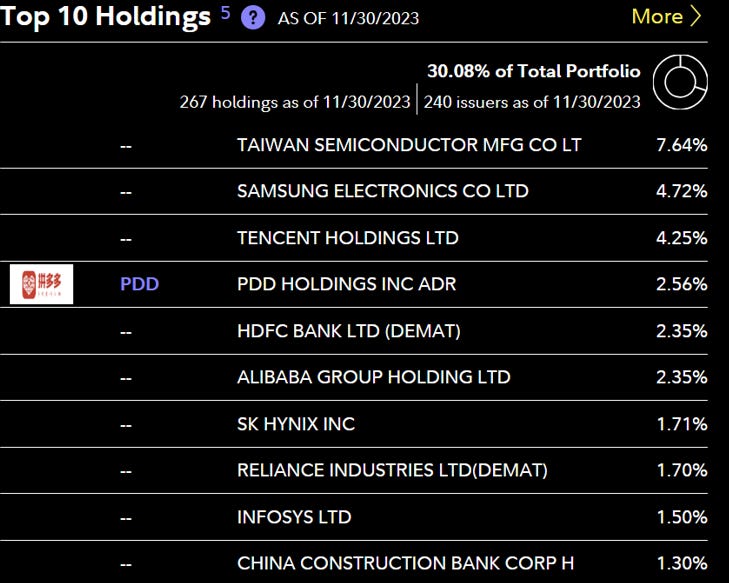
The top 10 stocks account for 30% of the fund. I can’t find any more detail on the remaining 70% of the fund. Maybe, given the China Construction Bank holding is 1.3%, there are at least 70 more holdings.
A quick note on fees. Here they are for the Emerging Markets Fund.

Looks almost free right? Well that’s because the target date fund – Fidelity Freedom 2035 – pays the fees based on the market value invested in that target date fund. It works its fees out as a weighted average of the fees of each of the underlying Fidelity investment products that the 2035 fund invests in (see above). It is likely that the pro-rata fee paid for the Emerging Markets Opportunity fund is close to the peer group average of 1.35% - you just don’t see it.
From that yahoo link, see the Category average. I recall seeing fees well in excess of that, even 2% per annum – I don’t know if the category average is weighted by market value or whether the 0.01% Fidelity fee is included in the average – it probably is – along with the same mechanism for other managers.

You will appreciate that there is a mountain of detail not covered in any kind of depth in these notes. I have avoided talking about entry and exit fees, for example – which can be 5%.
What I hope I have done is bring some clarity to what goes on in the target date fund sector.
Managers invest In their own products, not necessarily the best products in each sector that forms part of an arbitrary benchmark. Managers do not shoe the targeted extra returns they strive for given an also undisclosed risk budget. Fr emerging market equites in particular, there has been an underperformance of 10% per annum, with higher risk and fees than US equities – all whilst exporting US capital to ramp emerging equity market prices higher and deprive the US of that capital to invest in, say, inner cities or to build and improve the very infrastructure that is decaying in the US – roads, bridges, trains, airports to name a few items.
Who knows how much technology could have been developed In the US in ay sector, even “renewables”. There could have been many more Tesla’s appearing from nowhere at half the price.
If you think the US can withstand the damage done to the economy from the Biden junta’s insane economic policies that can only further bankrupt the country AND you think that kinetic wars or similar damage will not be done in pursuit of the UN’s Sustainable Development Goals in emerging markets, Target Date Funds might be a good idea.
O the other hand, you might consider doing some homework and do what is being done by investment managers for yourself – check it out with an independent investment advisor or even your bank manager though!
Remember, if you want to retire with 20 years of annual income of around 50,000 bucks a year to cover living and medical expenses, you will likely need to save around 700,000 bucks, assuming 5% returns and 7,600 bucks a year for twenty years.
You can use the same spreadsheet you created (if you dd!) to calculate the annuity table from Part `1 of this 2 part series here:
Happy “What if” and “Goal seeking”.
Onwards!
Please subscribe or donate via Ko-fi – any amount from 3 bucks upwards. Don’t worry and God Bless, if you can’t or don’t want to. Ko-fi donations here: https://ko-fi.com/peterhalligan - an annual subscription of 100 bucks is one third less than a $3 Ko-fi donation a week!