Mortality Summary, USA, 2020 to 2023
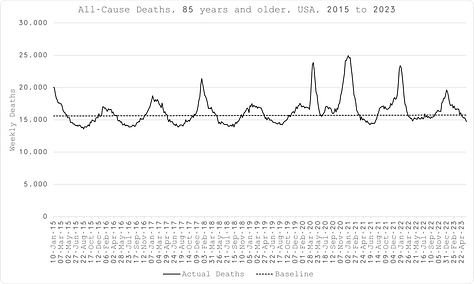
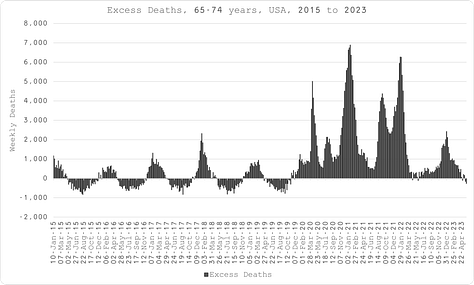
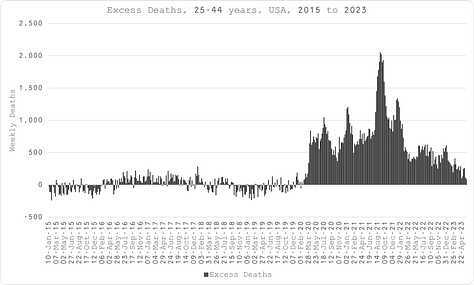
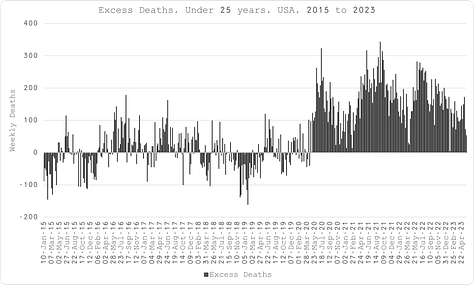
Excess mortality is significantly higher in the post-vax era, especially in the younger ages.
Headlines
In the “COVID” era, under 45 year-old Americans have suffered more life years lost due to non-COVID causes than COVID.
In every age group under 85, there have been more life years lost in the post-vax period than before.
Mortality returns to pre-pandemic levels, coinciding with a substantial drop in administration of the “vaccine”.
Excess Deaths
Here is a purely objective representation of mortality in the USA during the COVID era, pre- and post-vax, using official CDC data1 alone.
Total excess deaths for the period mid-March 2020 to May 2023 are 1,417,5212, of which 1,139,903 (80%) were attributed to COVID according to liberal and broad CDC definitions3.
Whereas, excess deaths post-vax are 730,0214, 6% higher than pre-vax, considering a conservative cutoff point of 03-Apr-21, i.e. one which puts all the substantial winter mortality into the pre-vax period, even though the programme started in mid-Dec 2020.
Moreover, excess deaths post-vax are progressively worse, as you move down through the age groups, ranging from a 52% reduction for the over 85s to a 207% increase for the under 25s.
Life Years Lost
Using actuarial life table expected remaining life5 from the mid-point of the age groups, the same data represented in terms of life years lost paints a more bleak picture.
Total life years lost for the whole period amount to 26,222,425, of which 17,420,051 have been attributed to COVID (66%).
Whereas, life years lost in the post-vax period are 15,082,025, 35% higher than pre-vax, when we would ordinarily expect excess mortality to be lower due to the pull-forward effect alone.
Finally, the age group suffering the worst loss of life overall is the 45 to 64 year olds, with the 24 to 44 year olds suffering the worst non-COVID life years lost, both by substantial margins over the older age groups.
Curiously, the 45 to 64 year olds also have the worst COVID life years lost, in spite of all the epidemiological data indicating that it is a disease of old, moribund people, strongly suggesting that COVID deaths are wrongly attributed.


Time Series Analysis
Observing the time series data, it is clear that the mortality distributions for the younger age groups are asynchronous, indicating that they do not share a common, contemporaneous cause as the older age groups, i.e. a deadly, respiratory pathogen6.
It is also evident that the 25 to 44 year olds have by far the most anomalous spike in mortality, in Sept 2021, 18 months into the “epidemic”, and a few months after that cohort is targeted for “vaccination”7.


Methodology


For context, this is more death than all lives lost in military conflict in the States since the 18th Century, including the American Civil War.
When a definitive diagnosis cannot be made, but the circumstances are compelling within a reasonable degree of certainty, certifiers may include the terms “probable” or “presumed” in the cause-of-death statement. When COVID-19 is reported as a cause of death on the death certificate, it is coded and counted as a death due to COVID-19. Subsequently, a “COVID” death is one where the code is present anywhere in the death certificate, not just underlying cause.
Around the same number of American deaths in the American Civil War and World War I combined.
Note that the fact that when “vaccinations” pretty much ceased entirely in mid-2022 and mortality returns to normal levels (mainly for the older age groups), can officially be waved away as a coincidence, so as to avoid future vaccine “hesitancy”.


