Unprecedented Mortality Signal in Young Brits of July '21 "Missed" by the Officials
More evidence why deaths by registration date is a completely useless metric.
Thanks to the efforts (and expense) of a subscriber, the ONS have released a dataset of deaths by date of occurrence and age for England and Wales, complementing the dataset I sponsored for England only.
This allows us to make a direct comparison between the deaths that actually occurred with the deaths the ONS report in their weekly bulletins, which rather inconveniently do not separate the data between the two countries (yes, Wales really is a country in its own right).
If you plot the two data series for all ages, you see what the lazy ONS management sees.
Notwithstanding the obvious delays around Christmas and some in Easter and summer, you fool yourself into thinking, meh, there’s about a 1-week delay in the majority of cases so, we’ll just keep churning out crap analyses based on this data, no matter what that upstart, armchair analyst keeps telling us.
But, by now, we all know that you can’t just lump all the ages together and jump to such conclusions, don’t we?! Not that we should… it’s their job, if only they would do it properly.
When you break it down by age, even aggregating 15 to 44 year olds (ONS age bucket from the 2018 report), the picture is somewhat different:
For sure, the tail off in the recent months is pretty damned obvious, right? In fact, the two series start to deviate from around April 2022. Yes, more than a year of artefact in the registration-data data and evidently a whole load of death that has indeed occurred but is yet to be reported. In other words, we have no idea how many deaths are missing from the last 18 months and where they should go. We can only speculate based on the obvious observation that the series would not tail off dramatically like that without an extraordinary reason.
It is, however, easy to quantify the historical artefact. Between 01-Apr-22 and 28-Jul-23, there were 22,389 deaths registered but only 17,148 of them occurred in the same period. In other words, almost a quarter of those deaths relate to a prior period. Not exactly “most deaths are reported within a week” type of hand-wave scenario, is it?
There are still many people using this data to make erroneous claims, even presenting them to investigative agencies so I apologise but I have to shout this again:
The current registration-date data anomalies represent nothing more than catching up with deaths that occurred a long time ago, possibly over a year. Any analysis using this dataset is erroneous at best.
Indeed, there are loads of data points over the 3-sigma level in the recent period. But, also look at the stochasticity of this data. This is noise. And registrations are high because the backlog of occurrences is being filled. It’s a signal but if you focus on it, you’re looking in the wrong place.
And here’s the bottom line - there is NO information in the registration-date data that isn’t already in the occurrence-date data if the two datasets are pulled at the same time. the only difference is that the deaths are in the correct place in the latter, but the wrong place in the former.
Moving on…
So, not only does the registration-date data create the illusion of something happening now that actually occurred some time in the past1, inevitably, it misses that “thing” when it did actually happen - in the past!
Take a look at week ending 23-Jul-21, highlighted in the chart. The ONS reported 313 deaths for that week. On average in 2018 and 2019, 293 15 to 44 year olds died each week in England & Wales, with a standard deviation of 18.
So, 313 deaths would be just over 1-sigma (fancy Greek letter used instead of standard deviation). Typical “expectation” bounds are 2 to 3 sigma, so this would not register as a signal in any analysis.
However, the actual number of deaths that occurred that week was 405 (at least, because this silly registration process can be somewhat indefinite).
This is a 6-sigma event.
This is “unprecedented”2. The chance of this happening without something causing it would be 2* 10^(-9) or 2 in a billion or 500 million-to-1 if it were fair betting odds.
Worse still, there are two subsequent periods where weekly deaths touch the 3-sigma mark (10-Sep-21 and 31-Dec-21). These are rare events for this cohort, and to follow each other so closely makes things even worse.
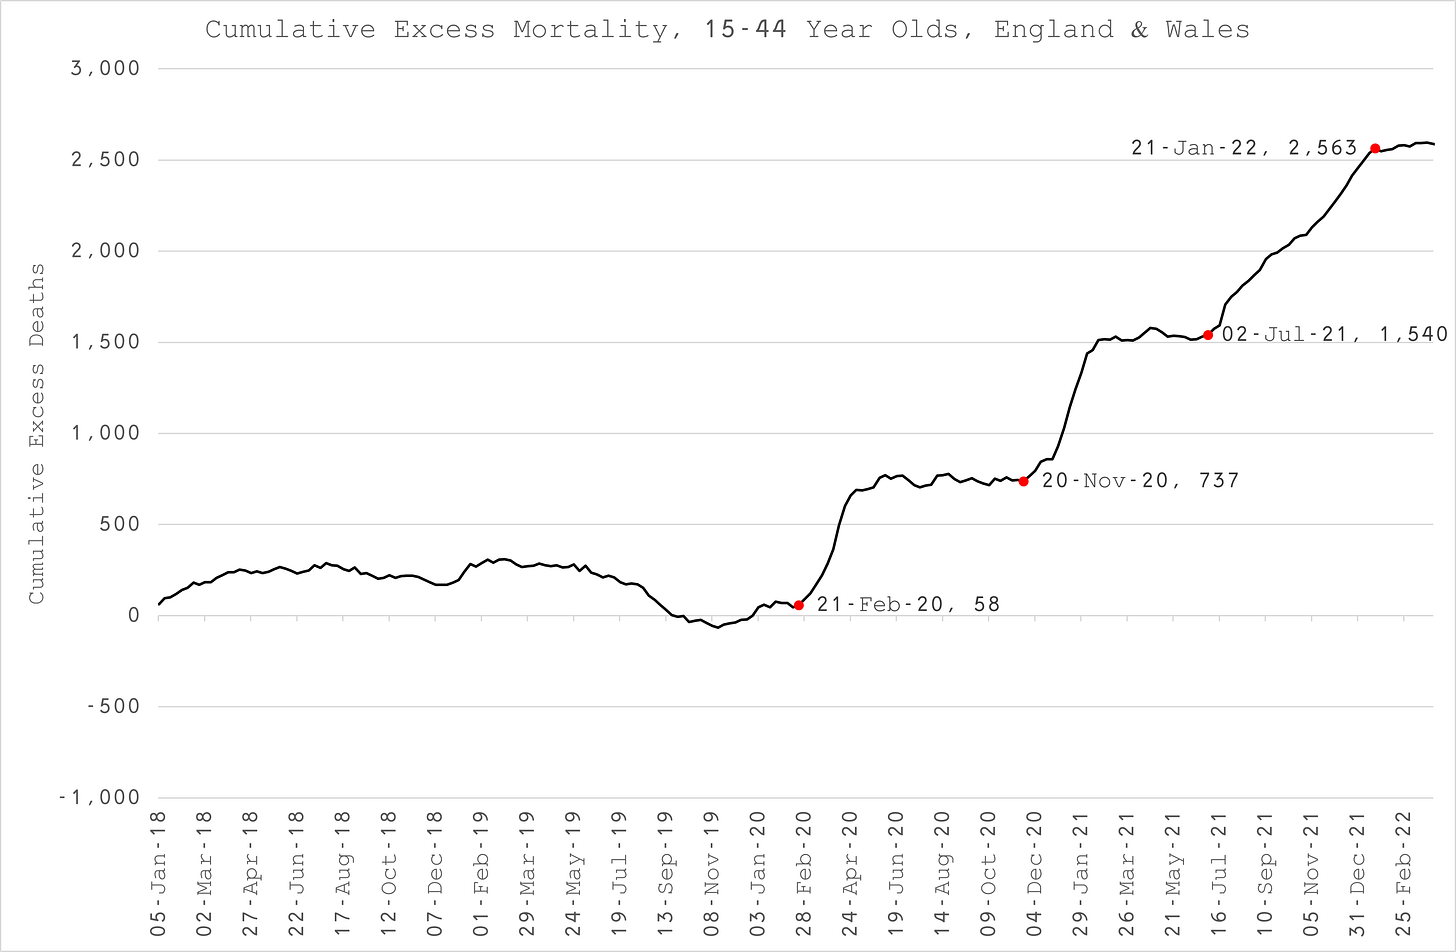
Moreover, it is also clear that deaths do not trend below mean thereafter (the pull-forward effect). We can see exactly how much excess or unexpected death there is looking at the cumulative series:
Evidently, there were 679 excess deaths for “epidemic” COVID (and associated iatrogenesis) for spring to autumn 2020; 803 for the same for autumn 2020 to spring 2021; and a prolonged period of 1,023 cumulative excess deaths in the “post-jab” era between summer 2021 and mid-winter 2022. In six months, we can revisit this when the few thousand missing deaths are finally reported and see where the post-jab era really tallies - inevitably, it will be much higher.
So, if the mortality event of summer 2021 was not possibly (probably!) due to random chance, what did cause it?
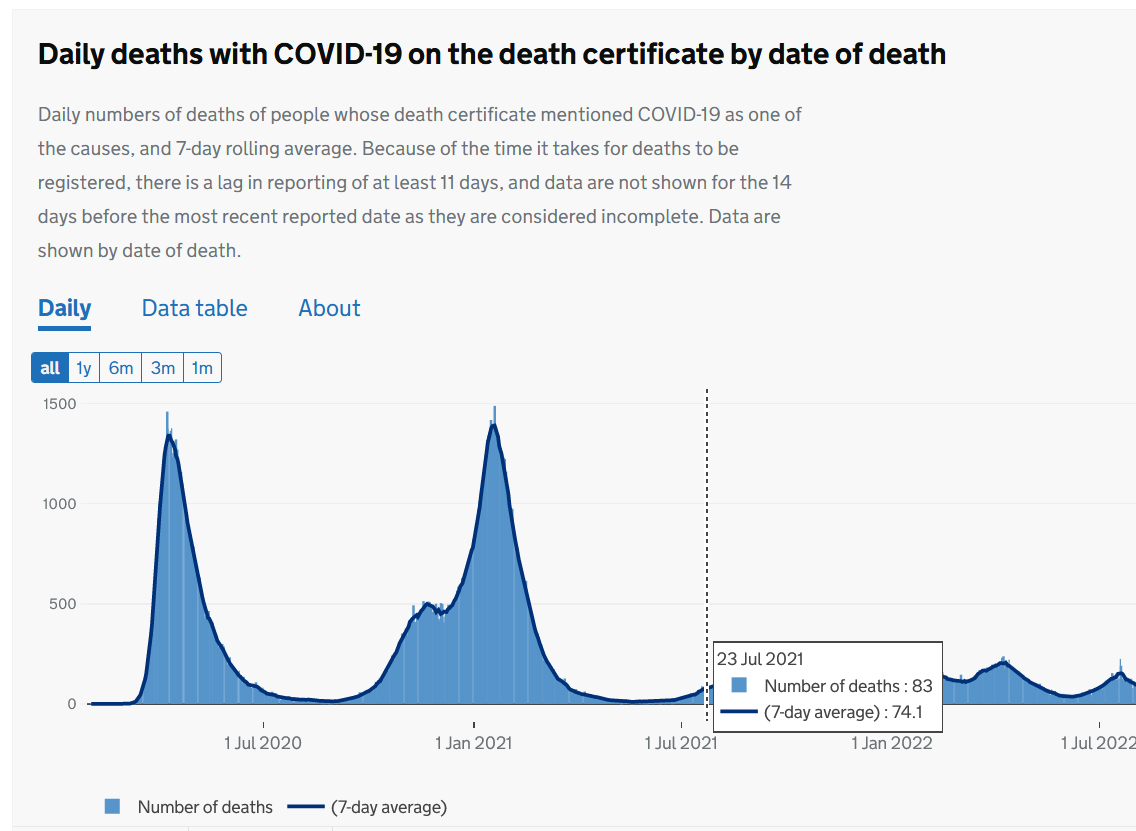
Here’s a clue: it wasn’t COVID3. There is little COVID death at that time, even by the most liberal of determination - “COVID-19 mentioned on the death certificate”.
Here’s another clue: it was the “vaccine”4.
How do we know? Or, rather, why do we suspect under the logical guide of Occam’s razor? Well, temporal proximity for one.
The new cumulative excess mortality series starts on 02-Jul-21, two weeks after the peak of of the jab campaign. That’s when “they” said deaths would fall precipitously. Oh?
And deaths peak on 23-Jul-21, right as the campaign stops. Oh?
And finally, why won’t this question be answered by the ONS? Because they never asked the question. If you don’t look (properly), there’s never anything to see.
However, the coroner knows something about it because the registration of those deaths were severely delayed. I guess the “investigative journalists” will cover this when they’ve finished salivating over Russell Brand’s salacious past life?
Oh, and how about that 23-Dec-22 spike? When we revisit this in about six months when the data might be almost complete, where do you think that is going to settle? I’m thinking every bit as high as the April 2020, Jan 2021 and July 2021 peaks.
Unfortunately, by the time we know, it will be waaaaay too late to do anything about it. Not that the “authorities” would, even if they simply collected the data on time. We know they won’t be honest with their analysis of it, otherwise they would have reported on July 2021 by now?
And if you think this is just some cherry-picked data point with no scientific or medical rationale, I’m afraid I’ve got more bad news for your narrative:
Notwithstanding the fact that if the deaths are distributed over a number of registration periods, they might not ever be noticed at all, even anachronistically.
It is twice as many unexpected deaths as those poor souls who lost their lives at the Ariana Grande concert in the Manchester Arena in May 2017.
Apparently, it still needs saying for the zealots - for it to be COVID, your hypothesis must prove why COVID is at least as virulent 15 months into the “pandemic” as it was when it first emerged, in spite of: a) viruses naturally attenuate; b) greater protective herd immunity; c) full-forward effect of excess mortality; d) weakest are already dead; e) seasonality; f) better treatments (less deleterious ventilation and sedation, more pragmatic, early use of anti-virals and anti-bacterials). If you cannot prove all of these, you must accept the other side of the coin, i.e. that the host has been compromised, generating a new cohort of susceptible people. Then, refute the multitude of literature demonstrating that the COVID “vaccine”: a) compromises the immune system for at least 2 weeks immediately post-jab; b) subverts the immune system longer term due to OAS (or immune imprinting to non-circulating strain); c) produces the same symptoms as the virus itself; d) PCR generates greater proportion of false-positives when there is low incidence; e) most importantly, ranks way off the scale for every single disease category, including fatal ones, in terms of adverse events. And, remember where the bar is set - demonstrate all of this to prove that the intervention was “safe and effective” - the July 2021 wave of excess death for 15 to 44 year olds comes immediately after the end of the jab campaign for this cohort. I do not have to prove that it caused the death but the odds are heavily stacked in my favour, all-the same.
Occam’s razor.


