Introducing RCP8.5 – the bogus outcome if society does not make concerted efforts to cut greenhouse gas emissions – it is the most extreme scenario amongst many others considered by the UN IPCC

First off, this movie should be compulsory viewing for every politician, education faculty and newsroom on the planet.
More detail here:
Now, let’s check out the progress on emissions in the US and EU over the last few decades.
From here: Greenhouse gas emissions - Our World in Data

European Union population has grown by around 10% from 400 million to around 440 million since the mid-1970’s whilst that of the US has grown by almost 60% from 216 million to around 338 million. That works out at a reduction of around 36% per capita for the US and 40% for the EU. Pretty good – let’s not look at China and India – ok, maybe a peek:

Where oh where could the problem be? And where oh where could the vast majority of “green” technology be sourced from? China ships in the raw materials from Africa and provides a huge amount of the battery’s ad components for turbines, EV’s and solar panels. Maybe China is the problem!
If you think you are paying “green” taxes, with the government awarding “green” subsidies in order to offset China’s “sins of emission” - you would be right!
Moving on.
Here is a link to the latest AR6 UN International Panel on Climate Change and its workings.
Sixth Assessment Report — IPCC
As with all massive bureaucracies it has a whole bunch of “working groups” – all feeding at the taxpayers trough – you pay taxes, they go to the UN, they eat expensive food, travel business class to meetings, stay at 5 star hotels and excrete swill in the form of garage reports that exclude the main causes of climate – the clouds and the sun – whilst using thermometers based mostly in heat islands in cities.
“The Working Group I contribution was released on 9 August 2021. The Working Group II and III contributions were released on 28 February and 4 April 2022 respectively. The Synthesis Report was released on 20 March 2023.”
Don’t worry, the working groups are still enjoying their taxpayer funded banquets and 5-star hotels for business trips”.
IPCC agrees on the set of scientific reports for the seventh assessment cycle — IPCC
“IPCC agrees on the set of scientific reports for the seventh assessment cycle”.
“In deliberations during the four-day meeting, the governments agreed to produce the three Working Group contributions to the Seventh Assessment Report, namely the Working Group I report on the Physical Science Basis, the Working Group II report on Impacts, Adaptation and Vulnerability and the Working Group III report on Mitigation of Climate Change. The Synthesis Report of the Seventh Assessment Report will be produced after the completion of the Working Group reports and released by late 2029.”
Late 2029. Right before the “2030” and “Net Zero” targets adopted by governments!
Abut those working groups. Note RCP = Representative Concentration Pathway that Wikipedia describes thusly Representative Concentration Pathway - Wikipedia
“The pathways describe different climate change scenarios, all of which are considered possible depending on the amount of greenhouse gases (GHG) emitted in the years to come. The RCPs – originally RCP2.6, RCP4.5, RCP6, and RCP8.5 – are labelled after a possible range of radiative forcing values in the year 2100 (2.6, 4.5, 6, and 8.5 W/m2, respectively).[1][2][3] The higher values mean higher greenhouse gas emissions and therefore higher global temperatures and more pronounced effects of climate change. The lower RCP values, on the other hand, are more desirable for humans but require more stringent climate change mitigation efforts to achieve them.”
You see the 8.5 W/m2 number and the reference to the year 2100? That is for the worst-case scenario – r at least, the worst case the “scientists” could construct – presumably with China and India’s greenhouse gas emissions increasing at the same rate as the last few decades and no further reduction in the less significant EU and US emissions!
“A short description of the four RCPs is as follows: RCP 1.9 is a pathway that limits global warming to below 1.5 °C, the aspirational goal of the Paris Agreement.[4] RCP 2.6 is a "very stringent" pathway.[4] RCP 3.4 represents an intermediate pathway between the "very stringent" RCP2.6 and less stringent mitigation efforts associated with RCP4.5.[5] RCP 4.5 is described by the IPCC as an intermediate scenario.[6] In RCP 6, emissions peak around 2080, then decline.[7] RCP7 is a baseline outcome rather than a mitigation target.[4] In RCP 8.5 emissions continue to rise throughout the 21st century.[8]: Figure 2, p. 223 ”
These are scenarios based on conditions at the time of AR6 in 2021 – the height of the C19 scamdemic.
From here:
Explainer: The high-emissions ‘RCP8.5’ global warming scenario (carbonbrief.org)
“Many different scenarios have been developed over recent decades of climate research. However, the ones that have principally been used to drive climate model runs – and that have largely driven discussions by policymakers and the public – include:
· Six IPCC 1992 (IS92) scenarios used in the Intergovernmental Panel on Climate Change (IPCC) second assessment report (SAR)
· Six Special Report on Emission Scenarios (SRES) used in the IPCC third (TAR) and fourth (AR4) assessment reports
· Four RCP scenarios used in the IPCC fifth assessment report (AR5)
· Nine forcing scenarios being developed for the upcoming IPCC sixth assessment report (AR6) based on the Shared Socioeconomic Pathways (SSPs).
Climate modellers have somewhat different needs in future emission scenarios than energy system modellers. While energy system modellers want to explore a range of different outcomes under different socioeconomic assumptions – such as future population and economic growth – climate modellers want outcomes that lead to distinctly different warming levels in order to effectively evaluate and compare the results.”
Lots of little piggies, feeding at lots of different troughs to produce lots of scenarios – dozens up dozens of scenarios – each eventually being assigned a probability – much like that discredited quack, Neil Ferguson of Imperial College London when he produced his scenarios if house arrest was not imposed on entire countries for C19.
Which brings us to the scenario gobbled up by politicians,
RCP8.5 – the worst-case scenario that is the “frightener”, the “boogey man” for chicken little morons use to run around frightening little kids whilst screeching “the sky is falling, the sky is falling!!!”
From the same link:
“A sizeable portion of recent studies on future climate impacts have focused on a warming scenario called “RCP8.5”. This high-emissions scenario is frequently referred to as “business as usual”, suggesting that is a likely outcome if society does not make concerted efforts to cut greenhouse gas emissions.”
Remember, the US and EU reduced greenhouse has emissions by 40% per capita over the last (almost) 50 years. China and India did not. Note that there is no detail on the main contributors to this worst-case scenario of “business as usual” for RCP8.5.
Meanwhile, back in the real world, the “renewable energy” policies designed to meet bogus “Net Zero” and “2030” targets have resulted in massive increased in electricity prices in the US, EU and UK – at least a doubling in the last few years.
Check out the top and bottom 10 US states with the highest and lowest prices (not reflecting the consecutive annual blackouts in California!)
From here:
Electricity Rates by State | March 2024 | ChooseEnergy.com®
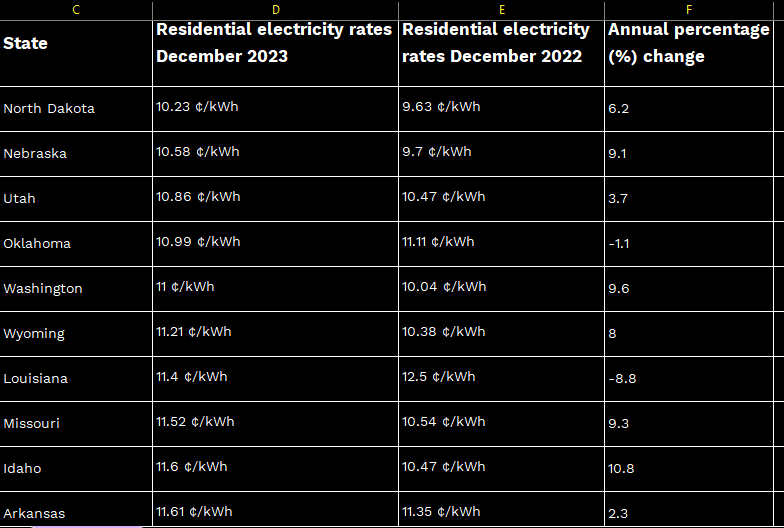
10 states with the highest residential electricity rates

10 states with the lowest residential electricity rates
Quite the difference on the west coast!

The better the climate the more expensive the electricity!
How about the east coast?

Is there a correlation between the costs of electricity and the stupidity of voters in making themselves poor?
I haven’t looked at household consumption of electricity by State, but the national average is 10,500 kw/h per annum Electricity use in homes - U.S. Energy Information Administration (EIA)
For Washington v California that works out at a difference of 18.30 cents per kw/h times 10,500 w/h per annum = 1,921 bucks a year. You get what you vote for! Maybe Washington has more windmills. After all, renewable energy should be free, right?
Stop Press:
From here:
“At present, the residential electricity in Beijing is charged based on a tiered pricing system. Based on the electricity consumed monthly, the household electricity consumption for the whole month is divided into three tiers, with the price increased for a higher tier. The maximum amount of the electricity consumed of the first tier is 240 kWh, and the electricity price is CNY 0.4883 per kWh if the level of voltage is lower than 1 kV, otherwise the price is CNY 0.4783 per kWh.
The amount of electricity consumed of the second tier ranges from 241 kWh to 400 kWh (inclusive), and the electricity price is CNY 0.5383 kWh if the level of voltage is less than 1 kV, otherwise the price is CNY CNY 0.5283 per kWh.
The amount of the electricity consumed of the third tier is above 400 kWh, and the electricity price is CNY 0.7883 per kWh if the level of voltage is less than 1 kV, otherwise the price is CNY 0.7783 per kWh.”
One US dollar buys 7.23 Chinese Yuan – so that works out at around 11 cents per kw/h -around the same price at that top rate as Washington Stgate
Onwards!!
Please subscribe ten bucks a month or annually for 100 bucks. You can also donate via Ko-fi – any amount from three bucks upwards. Ko-fi donations here: https://ko-fi.com/peterhalligan
Climate change is a crock of whooey !